Essays, tutorials, field notes, and project stories collected from VONNG.
This is the multi-page printable view of this section. .
Blog
Pigsty articles, engineering design notes, and the complete release archive.
-
1: Release
- 1.1: Pigsty v1.5.1
- 1.2: Pigsty v1.5.0
- 1.3: Pigsty v1.4.1
- 1.4: Pigsty v1.4.0
- 1.5: Pigsty v1.3.1
- 1.6: Pigsty v1.3.0
- 1.7: Pigsty v1.2.0
- 1.8: Pigsty v1.1.1
- 1.9: Pigsty v1.1.0
- 1.10: Pigsty v1.0.1
- 1.11: Pigsty v1.0.0
- 1.12: Pigsty v0.9.1
- 1.13: Pigsty v0.9.0
- 1.14: Pigsty v0.8.0
- 1.15: Pigsty v0.7.0
- 1.16: Pigsty v0.6.0
- 1.17: Pigsty v0.5.2
- 1.18: Pigsty v0.5.1
- 1.19: Pigsty v0.5.0
- 1.20: Pigsty v0.4.0
- 1.21: Pigsty v0.3.0
- 1.22: Pigsty v0.0.5
- 1.23: Pigsty v0.0.4
- 1.24: Pigsty v0.0.3
- 1.25: Pigsty v0.2.0
- 1.26: Pigsty v0.1.0
-
2: Article
- 2.1: Pigsty v1.5: Docker Application Support, Infrastructure Self-Monitoring
- 2.2: Pigsty v1.4: Modular Architecture, MatrixDB Data Warehouse Support
- 2.3: Pigsty v1.3: Redis Support, PGCAT Overhaul, PGSQL Enhancements
- 2.4: Pigsty v1.2: PG14 Default, Monitor Existing PG
- 2.5: Pigsty v1.1: Homepage, Jupyter, Pev2, PgBadger
- 2.6: Pigsty v1.0: GA Release with Monitoring Overhaul
- 2.7: Ready-to-Use PostgreSQL Distribution: Pigsty
- 2.8: Pigsty v0.9: CLI + Logs
- 2.9: Pigsty v0.8: Service Provisioning
- 2.10: Pigsty v0.7: Monitor-Only Deployments
- 2.11: Pigsty v0.6: Provisioning Upgrades
- 2.12: Pigsty v0.5: Declarative DB Templates
- 2.13: Pigsty v0.4: PG13 and Better Docs
- 2.14: Pigsty v0.3: First Public Beta
-
3: Design
1 - Release
Pigsty release archive using complete x.y.z version numbers.
Every stable numbered Pigsty tag through v4.5.0 has its own x.y.z page, including patch releases. Each record reconciles the long-form Pigsty release article, the historical About / Release Note archive, and the corresponding GitHub release or tag, then links the exact source comparison. Planned versions remain drafts until an actual tag is published.
1.1 - Pigsty v1.5.1
Grafana security hotfix
Highlights
IMPORTANT: Fixed the issue where CREATE INDEX|REINDEX CONCURRENTLY in PG14.0-14.3 could corrupt index data.
Pigsty v1.5.1 upgrades the default PostgreSQL version to 14.4. Strongly recommend updating ASAP.
Software Upgrades
- postgres upgraded to 14.4
- haproxy upgraded to 2.6.0
- grafana upgraded to 9.0.0
- prometheus upgraded to 2.36.0
- patroni upgraded to 2.1.4
Bug Fixes
- Fixed TYPO in
pgsql-migration.yml - Removed PID config item from HAProxy configuration
- Removed i686 packages from default packages
- Enabled all Systemd Redis Services by default
- Enabled all Systemd Patroni Services by default
API Changes
grafana_databaseandgrafana_pgurlmarked as deprecated API, will be removed in future versions
New Applications
- wiki.js: Build local Wikipedia with Postgres
- FerretDB: Provide MongoDB API using Postgres
Sources
1.2 - Pigsty v1.5.0
Docker application support
Highlights
- Complete Docker support: enabled by default on meta node with many out-of-the-box software templates: bytebase, pgadmin, pgweb, postgrest, minio, etc.
- Infrastructure self-monitoring: Nginx, ETCD, Consul, Prometheus, Grafana, Loki self-monitoring
- CMDB upgrade: compatibility improvements, supports Redis cluster/Greenplum cluster metadata, config file visualization
- Service discovery improvements: Consul can auto-discover all monitoring targets and integrate with Prometheus
- Better cold backup support: default scheduled backup tasks,
pg_probackupbackup tool, one-click delayed replica creation - ETCD can now be used as PostgreSQL/Patroni DCS service, as an alternative to Consul
- Redis playbook/role improvements: now allows init and remove operations for individual Redis instances, not just entire Redis nodes
Monitoring System
Dashboards
- CMDB Overview: visualize Pigsty CMDB Inventory
- DCS Overview: view Consul and ETCD cluster monitoring metrics
- Nginx Overview: view Pigsty Web access metrics and logs
- Grafana Overview: Grafana self-monitoring
- Prometheus Overview: Prometheus self-monitoring
- INFRA Dashboard redesigned to reflect overall infrastructure status
Monitoring Architecture
- Now allows Consul for service discovery (when all services are registered to Consul)
- All Infra components now enable self-monitoring and register to Prometheus and Consul via
infra_registerrole - Metrics collector pg_exporter updated to v0.5.0, new features:
scaleanddefault, allowing metric multiplication factors and default values pg_bgwriter,pg_wal,pg_query,pg_db,pgbouncer_stattime-related metrics now uniformly scaled to seconds from milliseconds/microseconds- Related counter metrics in
pg_tablenow have default value0instead ofNaN pg_classmetrics collector removed by default, related metrics added topg_tableandpg_indexcollectorspg_table_sizemetrics collector now enabled by default with 300-second cache time
Deployment
- New optional package
docker.tgzwith common app images: Pgadmin, Pgweb, Postgrest, ByteBase, Kong, Minio, etc. - New ETCD role: automatically deploys ETCD service on DCS Server nodes and integrates with monitoring
pg_dcs_typespecifies DCS service for PG high-availability: Consul (default), ETCD (alternative)node_crontabparameter for configuring node scheduled tasks like database backups, VACUUM, statistics collection- New
pg_checksumoption: when enabled, database cluster enables data checksums (previously onlycrittemplate enabled by default) - New
pg_delayoption: when instance is Standby Cluster Leader, this parameter configures a delayed replica - New
pg_probackuppackage, default rolereplicatornow has backup-related function permissions - Redis deployment split into two parts: Redis node and Redis instance,
redis_portparameter controls specific instances - Loki and Promtail now installed via
fpm-built RPM packages - DCS3 config template now uses a 3-node
pg-metacluster with a single-node delayed replica
Software Upgrades
- PostgreSQL upgraded to 14.3
- Redis upgraded to 6.2.7
- PG Exporter upgraded to 0.5.0
- Consul upgraded to 1.12.0
- vip-manager upgraded to v1.0.2
- Grafana upgraded to v8.5.2
- Loki & Promtail upgraded to v2.5.0, using fpm packaging
Bug Fixes
- Fixed Loki and Promtail default config filename issues
- Fixed Loki and Promtail environment variable expansion issues
- Complete English documentation translation and revision; documentation JS resources now served locally, no internet access required
API Changes
New Parameters
node_data_dir: Main data mount path, created if doesn’t existnode_crontab_overwrite: Overwrite/etc/crontabinstead of appendingnode_crontab: Node crontab content to append or overwritenameserver_enabled: Enable nameserver on this infra node?prometheus_enabled: Enable prometheus on this infra node?grafana_enabled: Enable grafana on this infra node?loki_enabled: Enable loki on this infra node?docker_enable: Enable docker on this infra node?consul_enable: Enable consul server/agent?etcd_enable: Enable etcd server/client?pg_checksum: Enable pg cluster data checksums?pg_delay: Application delay when backup cluster leader replays replication
Parameter Redesign
*_clean is now a boolean parameter for cleaning existing instances during init.
*_safeguard is also a boolean parameter to prevent cleaning running instances during any playbook execution.
pg_exists_action->pg_cleanpg_disable_purge->pg_safeguarddcs_exists_action->dcs_cleandcs_disable_purge->dcs_safeguard
Parameter Renames
node_ntp_config->node_ntp_enablednode_admin_setup->node_admin_enablednode_admin_pks->node_admin_pk_listnode_dns_hosts->node_etc_hosts_defaultnode_dns_hosts_extra->node_etc_hostsnode_dns_server->node_dns_methodnode_local_repo_url->node_repo_local_urlsnode_packages->node_packages_defaultnode_extra_packages->node_packagesnode_packages_meta->node_packages_metanode_meta_pip_install->node_packages_meta_pipnode_sysctl_params->node_tune_paramsapp_list->nginx_indexesgrafana_plugin->grafana_plugin_methodgrafana_cache->grafana_plugin_cachegrafana_plugins->grafana_plugin_listgrafana_git_plugin_git->grafana_plugin_githaproxy_admin_auth_enabled->haproxy_auth_enabledpg_shared_libraries->pg_libsdcs_type->pg_dcs_type
Sources
1.3 - Pigsty v1.4.1
Bug fixes & full English documentation translation
Bug fixes / Docker support / English documentation
Docker is now enabled by default on the meta node, allowing you to spin up various software.
Bug Fixes
- Fixed Promtail & Loki configuration variable issues
- Fixed Grafana legacy alerts
- Disabled nameserver by default
- Renamed pg-alias.sh for Patroni shortcuts
- Disabled exemplars queries for all dashboards
- Fixed Loki data directory issue
- Changed
autovacuum_freeze_max_agefrom 100000000 to 1000000000
Sources
1.4 - Pigsty v1.4.0
MatrixDB support, separated INFRA/NODES/PGSQL/REDIS modules
Architecture
- Decoupled system into 4 major categories:
INFRA,NODES,PGSQL,REDIS, making Pigsty clearer and more extensible - Single-node deployment =
INFRA+NODES+PGSQL - PGSQL cluster deployment =
NODES+PGSQL - Redis cluster deployment =
NODES+REDIS - Other database deployment =
NODES+ xxx (e.g.,MONGO,KAFKA…)
Accessibility
- CDN for mainland China
- Use
bash -c "$(curl -fsSL http://get.pigsty.cc/latest)"to get latest source - New
downloadscript to download and extract packages
Monitoring Enhancements
- Split monitoring into 5 categories:
INFRA,NODES,REDIS,PGSQL,APP - Logging enabled by default
lokiandpromtailnow enabled by default, with prebuilt loki-rpm
- Model and labels
- Added hidden
dsprometheus datasource variable to all dashboards - Added
iplabel to all metrics, used as join key between database and node metrics
- Added hidden
- INFRA Monitoring
- INFRA main dashboard: INFRA Overview
- Added Log dashboard: Logs Instance
- PGLOG Analysis and PGLOG Session now treated as sample Pigsty APPs
- NODES Monitoring Application
- Pigsty can be used standalone as host monitoring software
- Includes 4 core dashboards: Nodes Overview & Nodes Cluster & Nodes Instance & Nodes Alert
- New identity variables for nodes:
node_clusterandnodename
- PGSQL Monitoring Enhancements
- New PGSQL Cluster, simplified and focused on what matters in a cluster
- New dashboard PGSQL Databases for cluster-level object monitoring
- PGSQL Alert dashboard now focuses solely on PGSQL alerts
- PGSQL Shard added to PGSQL
- Redis Monitoring Enhancements
- Added node monitoring to all Redis dashboards
MatrixDB Support
- MatrixDB (Greenplum 7) can be deployed via
pigsty-matrix.ymlplaybook - MatrixDB monitoring dashboard: PGSQL MatrixDB
- Added sample configuration:
pigsty-mxdb.yml
Software Upgrades
- PostgreSQL 14.2
- PostGIS 3.2
- TimescaleDB 2.6
- Patroni 2.1.3 (Prometheus metrics + failover slots)
- HAProxy 2.5.5 (fixed stats errors, more metrics)
- PG Exporter 0.4.1 (timeout parameters, etc.)
- Grafana 8.4.4
- Prometheus 2.33.4
- Greenplum 6.19.4 / MatrixDB 4.4.0
- Loki now provided as RPM package instead of ZIP archive
Bug Fixes
- Removed Patroni’s Consul dependency, making migration to new Consul clusters easier
- Fixed Prometheus bin/new script default data directory path
- Added restart seconds in vip-manager systemd service
- Fixed typos and tasks
API Changes
New Variables
node_cluster: Identity variable for node clusternodename_overwrite: If set, nodename will be set to node’s hostnamenodename_exchange: Exchange node hostnames between play hosts (in/etc/hosts)node_dns_hosts_extra: Extra static DNS records easily overridable by single instance/clusterpatroni_enabled: If disabled, postgres & patroni bootstrap not executed duringpostgresrolepgbouncer_enabled: If disabled, pgbouncer not started duringpostgresrolepg_exporter_params: Extra URL parameters for pg_exporter when generating monitoring target URLpg_provision: Boolean variable indicating whether to execute provisioning part ofpostgresroleno_cmdb: Used forinfra.ymlandinfra-demo.ymlplaybooks, won’t create CMDB on meta node
Sources
1.5 - Pigsty v1.3.1
Dashboard polish, security fixes, and software upgrades
Monitoring
- PGSQL & PGCAT dashboard improvements
- Optimized PGCAT Instance & PGCAT Database layout
- Added key metric panels to PGSQL Instance dashboard (consistent with PGSQL Cluster)
- Added table/index bloat panels to PGCAT Database, removed PGCAT Bloat dashboard
- Added index information to PGCAT Database dashboard
- Fixed broken panels in Grafana 8.3
- Added Redis index to Nginx homepage
Deployment
- New
infra-demo.ymlplaybook for one-click bootstrap - New
infra-jupyter.ymlplaybook for optional JupyterLab server - New
infra-pgweb.ymlplaybook for optional PGWeb server - Added
pgalias on meta node for starting PostgreSQL cluster from admin user - Adjusted
max_locks_per_transactionsin all Patroni config templates pertimescaledb-tunerecommendations - Added
citus.node_conninfo: 'sslmode=prefer'to config templates for SSL-free Citus usage - Added all extensions (except pgrouting) from PGDG14 to package list
- Upgraded node_exporter to v1.3.1
- Added PostgREST v9.0.0 for generating REST APIs from PostgreSQL schemas
Bug Fixes
- Grafana security vulnerability fix (upgraded to v8.3.1, details)
- Fixed
pg_instance&pg_serviceissues inregisterrole when starting playbook mid-run - Fixed Nginx homepage rendering on hosts without
pg_clustervariable - Fixed style issues when upgrading to Grafana 8.3.1
Sources
1.6 - Pigsty v1.3.0
PGCAT overhaul & PGSQL enhancement & Redis beta support
Redis Support
| Feature | Description |
|---|---|
| Redis Deployment | Standalone, Sentinel, and Cluster modes |
| Redis Monitoring | Overview, Cluster, and Instance dashboards |
PGCAT Overhaul
| Dashboard | Description |
|---|---|
| PGCAT Instance | New instance-level catalog dashboard |
| PGCAT Database | New database-level catalog dashboard |
| PGCAT Table | Redesigned table-level dashboard |
PGSQL Enhancements
| Dashboard | Improvements |
|---|---|
| PGSQL Cluster | Added 10 key metric panels |
| PGSQL Instance | Added 10 key metric panels |
| PGSQL Service | Simplified and redesigned |
| Cross-references | Navigation links between PGCAT and PGSQL dashboards |
Monitor Deployment
- Grafana datasources auto-register during monitor-only deployment
Software Upgrades
- PostgreSQL 13 added to default package list
- PostgreSQL upgraded to 14.1 as default
- Added Greenplum RPM packages and dependencies
- Added Redis RPM and source packages
- Added
perfas default package
Sources
1.7 - Pigsty v1.2.0
Default PGSQL version upgraded to 14
Core Features
- Default to PostgreSQL 14
- Default to TimescaleDB 2.5 extension
- TimescaleDB and PostGIS enabled by default in CMDB
Monitor-Only Mode
- Monitor existing PostgreSQL instances via connection URL only
- pg_exporter deployed on local meta node
- New PGSQL Cluster Monly dashboard for remote clusters
Software Upgrades
- Grafana upgraded to 8.2.2
- pev2 upgraded to v0.11.9
- Promscale upgraded to 0.6.2
- PgWeb upgraded to 0.11.9
- New extensions: pglogical, pg_stat_monitor, orafce
Improvements
- Auto-detect machine specs and use appropriate
node_tuneandpg_conftemplates - Reworked bloat-related views, exposing more information
- Removed TimescaleDB and Citus internal monitoring
- Added
pgsql-audit.ymlplaybook for creating audit reports - All config templates simplified to two: auto and demo
Bug Fixes
- pgbouncer_exporter resource owner changed to
{{ pg_dbsu }}instead of postgres - Fixed pg_exporter duplicate metrics on pg_table/pg_index during
REINDEX TABLE CONCURRENTLY
Sources
1.8 - Pigsty v1.1.1
TimescaleDB upgrade and new Patroni templates
- Replaced TimescaleDB
apacheversion withtimescaleversion - Upgraded Prometheus to 2.30
- Fixed pg_exporter config directory owner issue (changed to
{{ pg_dbsu }})
Upgrade Notes
The main change in this version is TimescaleDB — using the official TimescaleDB License (TSL) version to replace the Apache License v2 version from the PGDG repository.
1.9 - Pigsty v1.1.0
Homepage, JupyterLab, PGWEB, Pev2 & pgbadger
Feature Enhancements
- Added
pg_dummy_filesizeto create filesystem space placeholder - Major homepage redesign
- Added JupyterLab integration
- Added PGWeb console integration
- Added PgBadger support
- Added PEV2 support, execution plan visualization tool
- Added pglog tooling
Software Upgrades
- PostgreSQL upgraded to v13.4 (with official PG14 support)
- pgbouncer upgraded to v1.16 (metric definitions updated)
- Grafana upgraded to v8.1.4
- Prometheus upgraded to v2.29
- node_exporter upgraded to v1.2.2
- HAProxy upgraded to v2.1.1
- Consul upgraded to v1.10.2
- vip-manager upgraded to v1.0.1
API Changes
nginx_upstreamnow has different structure (incompatible)- New config entry:
app_list, navigation entries rendered to homepage - New config entry:
docs_enabled, setup local docs on default server - New config entry:
pev2_enabled, setup local PEV2 tool - New config entry:
pgbadger_enabled, create log summary/report directory - New config entry:
jupyter_enabled, enable JupyterLab server on meta node - New config entry:
jupyter_username, specify user to run JupyterLab - New config entry:
jupyter_password, specify default password for JupyterLab - New config entry:
pgweb_enabled, enable PGWeb server on meta node - New config entry:
pgweb_username, specify user to run PGWeb - Renamed internal flag
repo_existtorepo_exists repo_addressdefault value changed topigstyinstead ofyum.pigsty- HAProxy access point changed to
http://pigstyinstead ofhttp://h.pigsty
Sources
1.10 - Pigsty v1.0.1
Bug fixes and documentation improvements
2021-09-14
Documentation Update
- Chinese documentation now available
- Machine-translated English documentation now available
Bug Fixes
pgsql-removeno longer removes primary instances- Replaced pg_instance with pg_cluster + pg_seq (Start-At-Task could fail when pg_instance undefined)
- Removed Citus from default shared preload libraries (Citus forces max_prepared_transaction to non-zero)
- Added ssh sudo check in
configure(now usesssh -t sudo -n lsfor permission check) - Fixed
pg-backupscript typo
Optimizations
- Removed NTP sanity check alert (duplicate of ClockSkew)
- Removed collector.systemd to reduce overhead
Sources
1.11 - Pigsty v1.0.0
v1 GA, Monitoring System Overhaul
Monitoring System Overhaul
- New dashboards on Grafana 8.0
- New metric definitions, added PG14 support
- Simplified labeling system: static label set (job, cls, ins)
- New alerting rules and derived metrics
- Monitor multiple databases simultaneously
- Real-time log search & csvlog analysis
- Richly-linked dashboards, click through for drill-down/roll-up
Architecture Changes
- Added Citus and TimescaleDB to default installation
- Added PostgreSQL 14beta2 support
- Simplified HAProxy admin page indexing
- Decoupled infrastructure and PGSQL by adding new role
register - Added new roles
lokiandpromtailfor logging - Added new role
environto setup environment for admin user on meta node - Default to
staticservice discovery for Prometheus (instead ofconsul) - Added new role
removefor graceful cluster and instance removal - Upgraded Prometheus and Grafana provisioning logic
- Upgraded to vip-manager 1.0, node_exporter 1.2, pg_exporter 0.4, Grafana 8.0
- Every database on every instance auto-registers as a Grafana datasource
- Moved Consul registration to
registerrole, changed Consul service tags - Added cmdb.sql as pg-meta baseline definition (CMDB & PGLOG)
Application Framework
- Extensible framework for new features
- Core app: PostgreSQL monitoring system
pgsql - Core app: PostgreSQL catalog explorer
pgcat - Core app: PostgreSQL csvlog analyzer
pglog - Added sample app
covidfor COVID-19 data visualization - Added sample app
isdfor ISD weather data visualization
Other
- Added JupyterLab for full Python data science environment
- Added
vonng-echarts-panelto restore ECharts support - Added wrapper scripts
createpg,createdb,createuser - Added CMDB dynamic inventory scripts:
load_conf.py,inventory_cmdb,inventory_conf - Removed obsolete playbooks:
pgsql-monitor,pgsql-service,node-remove, etc.
API Changes
- New variable:
node_meta_pip_install - New variable:
grafana_admin_username - New variable:
grafana_database - New variable:
grafana_pgurl - New variable:
pg_shared_libraries - New variable:
pg_exporter_auto_discovery - New variable:
pg_exporter_exclude_database - New variable:
pg_exporter_include_database - Variable renamed:
grafana_url→grafana_endpoint
Bug Fixes
- Fixed default timezone Asia/Shanghai (CST) issue
- Fixed nofile limits for pgbouncer & patroni
- pgbouncer user list and database list now generated when running tag
pgbouncer
Sources
1.12 - Pigsty v0.9.1
Three-step installer, PostgreSQL 13.3, and Grafana 7.5.6
Update package version:
- PostgreSQL 13.3
- Grafana 7.5.6
Add configure support.
Now install pigsty with 3 steps: download, configure and install:
WoW! just like old time!
Sources
1.13 - Pigsty v0.9.0
Pigsty GUI, CLI, Logging Integration
New Stuff
- One-liner install:
curl -fsSL https://pigsty.cc/install | bashbootstraps everything. pigsty-cli: wraps the common Ansible playbooks so you stop copy-pasting command lines. Still beta but already handy.- Loki + Promtail: Postgres, pgbouncer, and Patroni logs stream into Grafana with metrics extracted from log volume.
infra-loki.ymlandpgsql-promtail.ymlwire things up. - Binary exporters: grab monitoring binaries with
files/get_bin.shif you don’t want to rely on repos. - Flight mode: once the meta node is initialized you can run
bin/upgradeto switch into a dynamic inventory using data stored insidepg-meta.
Fixes
- Cleaned up HAProxy health checks that were flooding PG and Patroni logs with
connection resetnoise. - Patroni logs now carry readable timestamps (no more millisecond fragments) and explicit time zones.
- Monitoring queries run by
dbuser_monitorlog only when slower than 1s. - Grafana role refactor keeps the API stable, but uses CDN-hosted plugin bundles for faster installs.
- Pgbouncer user creation now handles md5 passwords properly.
- Hardened SQL templates for DB/user creation, fixed DNS orchestration edge cases, and tidied Makefile typos.
Knob Changes
node_disable_swapdefaults tofalse; Pigsty no longer nukes swap by default.node_sysctl_paramsstops writing kernel tunables unless you explicitly set them.grafana_plugin: installnow means “download from CDN if cache is missing.”repo_url_packagespulls extra RPMs from the Pigsty CDN so installs inside China work out of the box.proxy_env.no_proxyincludes the CDN endpoints.grafana_customizedefaults tofalse; flip it on only if you have the Pigsty Pro UI bits.node_admin_pk_currentadds your current~/.ssh/id_rsa.pubto the admin account.- Loki/Promtail knobs:
loki_clean,loki_data_dir,promtail_enabled,promtail_clean,promtail_port,promtail_status_file,promtail_send_url.
Sources
1.14 - Pigsty v0.8.0
Service Provision
v0.8 finalizes the provisioning API. Services are completely rebuilt: instead of a hard-coded primary/replica pair you can now declare any number of services, plug in HAProxy, swap in an external load balancer, or hand off to a custom VIP controller. Everything else in the supply chain stabilizes on top of this model.
Service API
The old vip and haproxy knobs moved under the service role. pg_services (plus pg_services_extra) define each exposed endpoint—name, ports, selectors, health checks, weights, and balancer hints. Selectors are JMESPath filters over cluster members, and optional selector_backup pools handle fail-in when replicas are gone. Out of the box we ship primary, replica, default, and offline service definitions; swap dst_port to point at postgres, pgbouncer, or any number.
The HAProxy stanza keeps per-service tuning (maxconn, algorithm, timeouts) while VIP config distinguishes L2/L4 implementations so you can drop Pigsty behind an existing load balancer.
Database Interface Tweaks
Locales can now be split into lc_collate and lc_ctype so extensions like pg_trgm behave with non-C collations. The rest of the pg_databases schema stays the same—owner/template/encoding/connlimit/revokeconn/pgbouncer/comment—just with better defaults and inline comments.
Sources
1.15 - Pigsty v0.7.0
Monitor only deployment
Pigsty v0.7 focuses on plugging existing fleets into Pigsty’s observability stack. The new monitor-only flow lets you drop Pigsty dashboards onto databases that were provisioned elsewhere, and the declarative APIs for databases and users got a much needed redesign.
Highlights
- Monitor-only deployment flow (
monly) with its own playbook. - Split static Prometheus target files by cluster for easier hand-editing.
- New helper playbooks:
pgsql-createuser.ymlandpgsql-createdb.ymlfor live clusters. - Database and user schema definitions now cover owner/template/locale knobs plus per-role capabilities.
- Bug fixes for extension schema typos and pgbouncer reload.
API Changes
New options:
Removed option:
Structures affected: pg_default_roles, pg_users, pg_databases. Also fixed the pg_default_privilegs typo → pg_default_privileges.
Monitor-Only Mode
When you just want Pigsty’s observability without touching the way databases were provisioned, run the monly flow. Infra still gets bootstrapped on the meta node via ./infra.yml, but database nodes skip the provisioning playbooks and only run ./pgsql-monitor.yml. Config gets much shorter—most of the time you only keep infra vars and a handful of monitoring knobs.
Database Provisioning Interface
pg_databases now exposes owner/template/encoding/locale/connlimit/allowconn knobs plus revokeconn (strip CONNECT from public) and inline comments. Use ./pgsql-createdb.yml -e pg_database=<name> to create or mutate live databases; the generated SQL lives inside /pg/tmp/pg-db-<name>.sql on the primary.
User Provisioning Interface
pg_users swapped username → name, groups → roles, and exploded options into discrete flags (login, superuser, createdb, createrole, inherit, replication, bypassrls, connlimit). Users can also get expire_at / expire_in timers plus pgbouncer defaults to false. Apply changes through ./pgsql-createuser.yml -e pg_user=<name> which renders /pg/tmp/pg-user-<name>.sql on the primary.
Sources
1.16 - Pigsty v0.6.0
Architecture Enhancement
Pigsty v0.6 responds to user feedback with a redesigned provisioning path plus a monitoring stack that can sit beside any managed PG fleet—even a MyBase cluster built elsewhere.
Bug Fixes
- Patroni no longer resets PG HBA on restart.
- Fixed copy typos and the default primary for the
pg-testsandbox cluster. - Patched the dashboard title typo on PG Overview.
Feature Work
- Monitoring supply chain overhaul: Prometheus can now run fully static, exporters accept
service_registrytoggles, andexporter_binary_installlets you drop binaries without hitting repos. Each exporter has its own*_enabledflag. - Prometheus static discovery is rendered straight from inventory, so you can graft Pigsty dashboards onto any PG-as-a-service footprint.
- HAProxy provisioning adds a global console at
h.pigsty, optional auth, fallback routing to the primary when all replicas die, and per-service weight tuning. - ACL defaults now include
dbrole_offlinefor slow-query/ETL workloads plus HBA rules that fence those workloads to marked nodes. - Component refresh: PostgreSQL 13.2, Prometheus 2.25, pg_exporter 0.3.2, node_exporter 1.1, Consul 1.9.3, and a faster ZJU PG mirror.
API Changes
New knobs:
Removed knobs:
Sources
1.17 - Pigsty v0.5.2
Playbook restructuring, VIP/HAProxy controls, and configuration cleanup
[!INFO]
This historical version is represented by its Git tag and source tree because no GitHub Release was published.
Highlights
- Made
pigsty.ymlthe default configuration and reorganized the standardsandbox.yml,infra.yml, andpgsql.ymlworkflows. - Split VIP management from HAProxy and added administrator authentication, traffic weights, and primary fallback controls.
- Added the nameserver step to the main playbook and refreshed the accompanying documentation.
v0.5.2 is a tagged maintenance snapshot without a separately authored GitHub Release body.
Sources
1.18 - Pigsty v0.5.1
Dashboard fixes, the ZJU mirror, and documentation refresh
[!INFO]
This historical version is represented by its Git tag and source tree because no GitHub Release was published.
Highlights
- Fixed PostgreSQL cluster and instance dashboard issues found after
v0.5.0. - Switched the default PostgreSQL mirror to Zhejiang University for faster regional installs.
- Refreshed the README and consolidated the
v0.5documentation snapshot.
v0.5.1 is a tagged maintenance snapshot without a separately authored GitHub Release body.
Sources
1.19 - Pigsty v0.5.0
Database Customize Template
Outline
- The official docs site (http://pigsty.cc/) is live.
- Database templating becomes fully declarative: define users, roles, databases, ACLs, extensions, and schemas in config.
- The default access model is refined and HBA management now comes straight from Pigsty instead of Patroni.
- Grafana provisioning switched from shoving a sqlite file to JSON provisioning via API.
- Added the
pg-cluster-replicationdashboard to the open bundle. - CentOS 7.8 offline bundle:
pkg.tgz.
Declarative Database Layouts
Multi-tenant headaches go away once everything is described as code. The new templates let you declare users, passwords, role hierarchies, DB defaults, extensions, schemas, and default privileges in YAML so a single config file replaces piles of runbooks. A stripped example:
1.20 - Pigsty v0.4.0
PostgreSQL 13 Support, Official Documentation
Pigsty v0.4 is our second public beta. The observability stack was rebuilt around Grafana 7.3, and ten curated dashboards became the default open-source payload. pg_exporter 0.3.1 drives metrics, and the alert wiring has been cleaned up for the new Grafana release.
Open-Source Dashboards
The OSS build now exposes ten high-signal Grafana panels: PG Overview, Cluster, Service, Instance, Database, Query, Table, Table Catalog, Table Detail, and Node. Even with a lean set it easily outclasses most “enterprise” PG monitoring suites.
Software Refresh
- PostgreSQL 13.1 + Patroni 2.0.1-4, with citus added to the repo
- pg_exporter upgraded to 0.3.1
- Grafana jumps to 7.3; a ton of compatibility fixes landed
- Prometheus 2.23 with the new UI enabled
- Consul 1.9 and related components updated
Other Improvements
- Updated Prometheus alert rules and Alertmanager info links
- Fixed a batch of bugs and typos
- Added a tiny backup script for quick dumps
Offline Bundle
Need an air-gapped install? Grab the CentOS 7.8 package bundle (pkg.tgz) from GitHub and deploy from local media.
Sources
1.21 - Pigsty v0.3.0
Provisioning Solution GA
Pigsty v0.3.0 is the very first public preview. It packages a lean observability stack plus a reproducible offline bundle so you can spin up a real PostgreSQL lab without touching the public Internet.
Observability Stack
The open build ships eight curated Grafana dashboards: PG Overview, Cluster, Service, Instance, Database, Table Overview, Table Catalog, and a bare-metal Node view. Even with a trimmed set the coverage still crushes most “enterprise” monitoring stories.
Offline Bundle
Shipyard environments can fetch the CentOS 7.8 offline bundle directly from GitHub (pkg.tgz). Drop it on the management node and you have a deterministic install no matter how broken the mirrors are.
Sources
1.22 - Pigsty v0.0.5
Offline installation, Consul role, and HAProxy fixes
[!INFO]
This historical version is represented by its Git tag and source tree because no GitHub Release was published.
Highlights
- Added an offline installation mode for environments without Internet access.
- Introduced a dedicated Consul role and refreshed repository bootstrap behavior.
- Added psql startup helpers, split PostgreSQL script tasks, and fixed HAProxy connection-reset noise.
This historical record is reconstructed from the v0.0.5 tag and its source comparison with v0.0.4.
Sources
1.23 - Pigsty v0.0.4
Ansible role split, networking, and repository refactor
[!INFO]
This historical version is represented by its Git tag and source tree because no GitHub Release was published.
Highlights
- Split the former monolithic automation into dedicated Meta, Grafana, DNS, Nginx, and Prometheus roles.
- Added static-network handling and revised the local repository upstream policy.
- Expanded role documentation while keeping service registration templates aligned with the new layout.
This historical record is reconstructed from the v0.0.4 tag and its source comparison with v0.0.3.
Sources
1.24 - Pigsty v0.0.3
Interface and monitoring-schema improvements
[!INFO]
This historical version is represented by its Git tag and source tree because no GitHub Release was published.
Highlights
- Improved the early Pigsty configuration interface and added the monitoring schema.
- Added a Kubernetes playbook and refined the PostgreSQL initialization defaults.
- Simplified the Vagrant bootstrap path and fixed several HAProxy, Patroni, and exporter registration details.
This historical tag predates the public release series. Its record is reconstructed from the tagged source and the commit history leading to v0.0.3.
Sources
1.25 - Pigsty v0.2.0
Provisioning refactor, etcd DCS, and HAProxy 2.2 support
[!INFO]
This historical version is represented by its Git tag and source tree because no GitHub Release was published.
Highlights
- Refactored the infrastructure, node, repository, Patroni, PgBouncer, monitoring, and PostgreSQL initialization roles.
- Added etcd as a DCS option, production/test inventory layouts, and configurable database superuser support.
- Added Patroni pause handling, HAProxy 2.2 compatibility, and fixes for older CentOS 7 environments.
v0.2.0 predates curated GitHub Release notes. This record is reconstructed from the tagged source and the comparison with v0.1.0.
Sources
1.26 - Pigsty v0.1.0
Test-environment validation after the initial role-based restructuring
[!INFO]
This historical version is represented by its Git tag and source tree because no GitHub Release was published.
Highlights
- Completed the first large-scale conversion from playbooks to reusable Ansible roles.
- Established the initial PostgreSQL primary/standby, PgBouncer, monitoring, HAProxy, Keepalived, and repository workflows.
- Validated the reorganized project in a production-like test environment.
v0.1.0 is an early engineering milestone rather than a curated GitHub Release. The notes are reconstructed from the tag and its commit history.
Sources
2 - Article
Pigsty essays, tutorials, field notes, and project stories collected from VONNG.
This column collects every article in VONNG’s dedicated Pigsty section, plus articles in other columns whose front matter explicitly carries the Pigsty tag. Original page resources and available English translations are preserved.
2.1 - Pigsty v1.5: Docker Application Support, Infrastructure Self-Monitoring
Originally published on VONNG.

Pigsty v1.5 is officially released! Complete Docker support brings a rich application ecosystem — countless database-backed software works out of the box!
Other improvements include: infrastructure self-monitoring, better cold backup support, new CMDB compatible with Redis and Greenplum, ETCD as high-availability DCS, and better log collection and visualization. GitHub Stars crossed 500!
Highlights
| Feature | Description |
|---|---|
| Docker Support | Enabled by default on meta node, with rich out-of-the-box software templates |
| Infra Self-Monitoring | Nginx, ETCD, Consul, Prometheus, Grafana, Loki |
| CMDB Upgrade | Supports Redis/Greenplum cluster metadata, configuration visualization |
| Service Discovery | Consul auto-discovers monitoring targets for Prometheus |
| Cold Backup Enhancement | Default scheduled backups, pg_probackup, one-click delayed replica |
| ETCD as DCS | Alternative to Consul for PostgreSQL/Patroni |
| Redis Improvements | Supports single-instance level init and remove operations |
Docker Support
The most important feature in Pigsty v1.5 is Docker support. Countless software and tools can work out of the box via Docker: out-of-the-box database + out-of-the-box applications = out-of-the-box software solutions.
Many software products need databases, but putting databases in containers remains controversial. There’s a huge gap between Docker-based toy databases and production-grade databases. Pigsty combines the best of both: stateful databases are managed by Pigsty, running on standard physical or virtual machines (like PostgreSQL and Redis); stateless applications run via Docker, with their state stored in Pigsty-managed external databases.
In Pigsty v1.4.1, Docker was added as an experimental feature; in v1.5, Docker becomes a default Pigsty component, enabled by default on the meta node. Regular nodes have it disabled by default, but you can enable Docker on all nodes via configuration.
Application Ecosystem
Docker itself is just a tool — what matters is the massive application ecosystem Docker represents!
Pigsty curated some commonly used software, especially those using PostgreSQL and Redis, providing one-click launch tutorials and shortcuts, plus an offline-ready Docker image package docker.tgz.
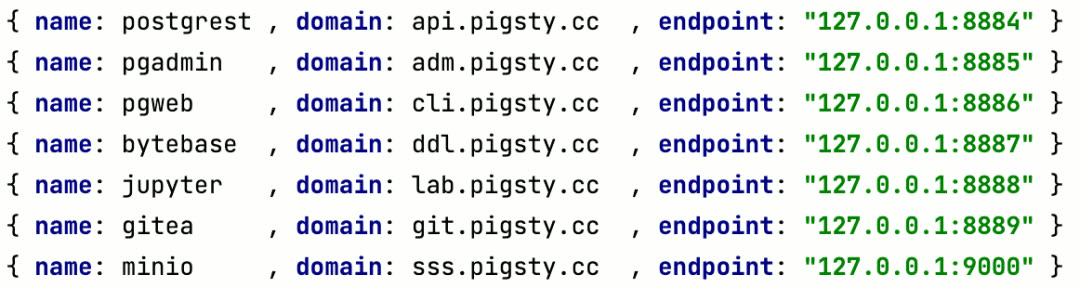
Code Hosting Platform: Gitea
To start a private code hosting service, use this command to launch Gitea:
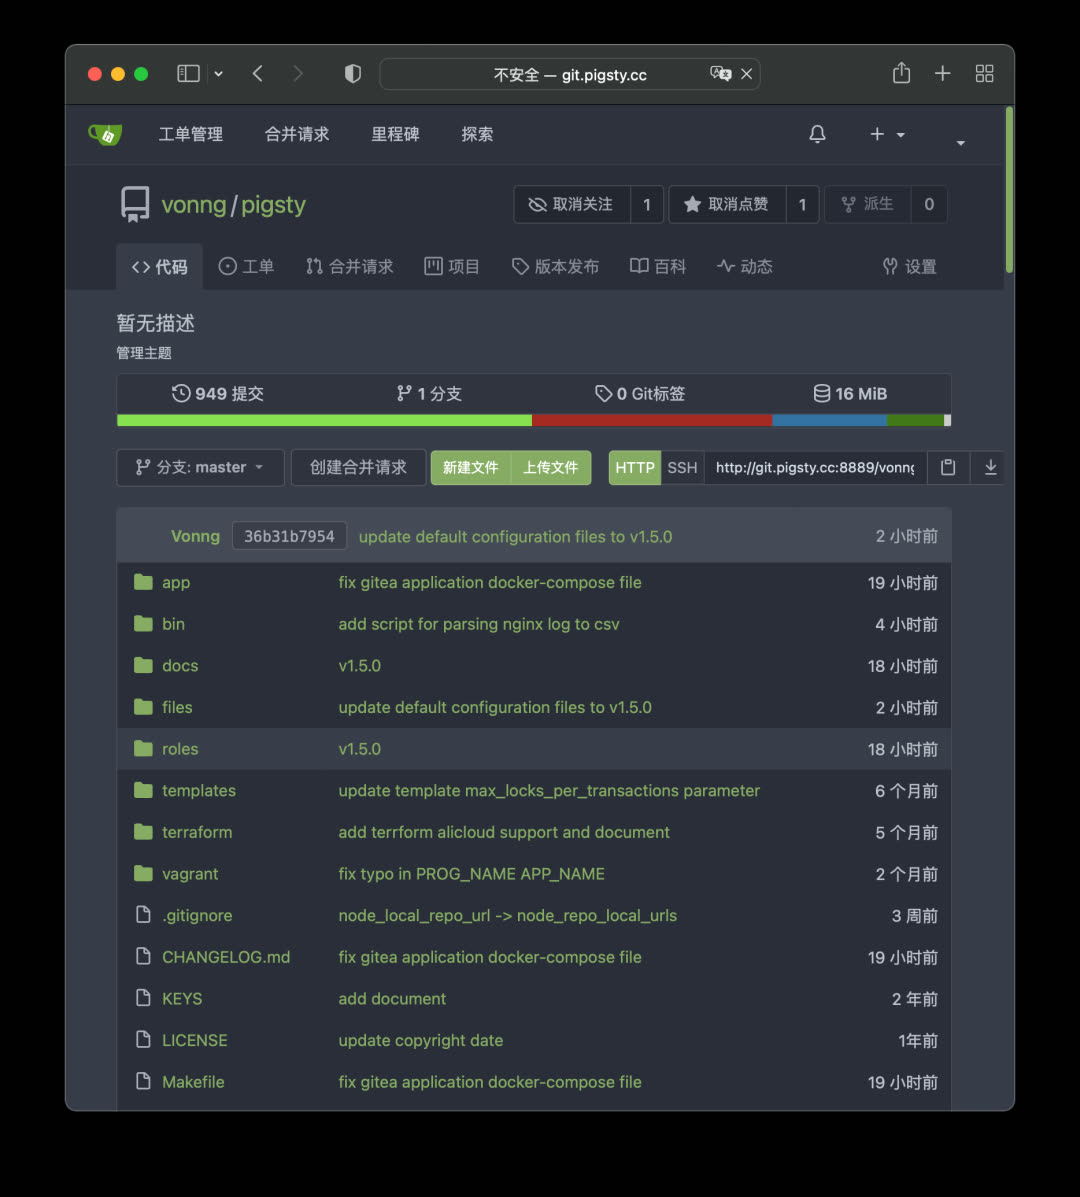
This command uses Docker Compose to launch the Gitea image, using Pigsty’s default CMDB pg-meta.gitea as metadata storage. Access the domain or port specified in the config file to access your code hosting service.
Database Management Platform: PgAdmin
PgAdmin4 is a classic PostgreSQL management tool with many useful features. Pigsty provides the latest PgAdmin4 6.9 support — just one command to start the image, automatically loading all managed database instances from Pigsty.
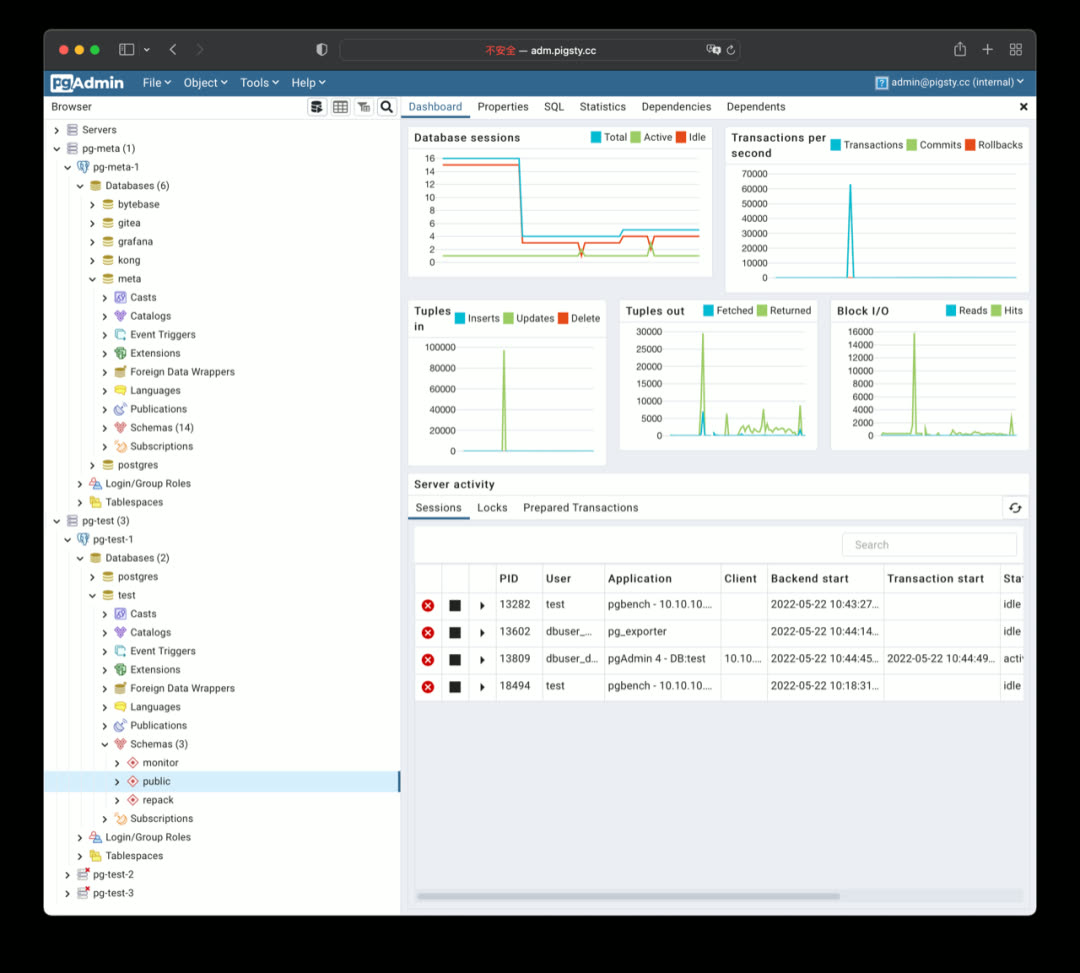
Schema Change Tool: Bytebase
Bytebase is a schema change management tool designed for PostgreSQL, using Git workflows and ticket approval to version-control database schemas. Bytebase itself stores metadata in PostgreSQL.
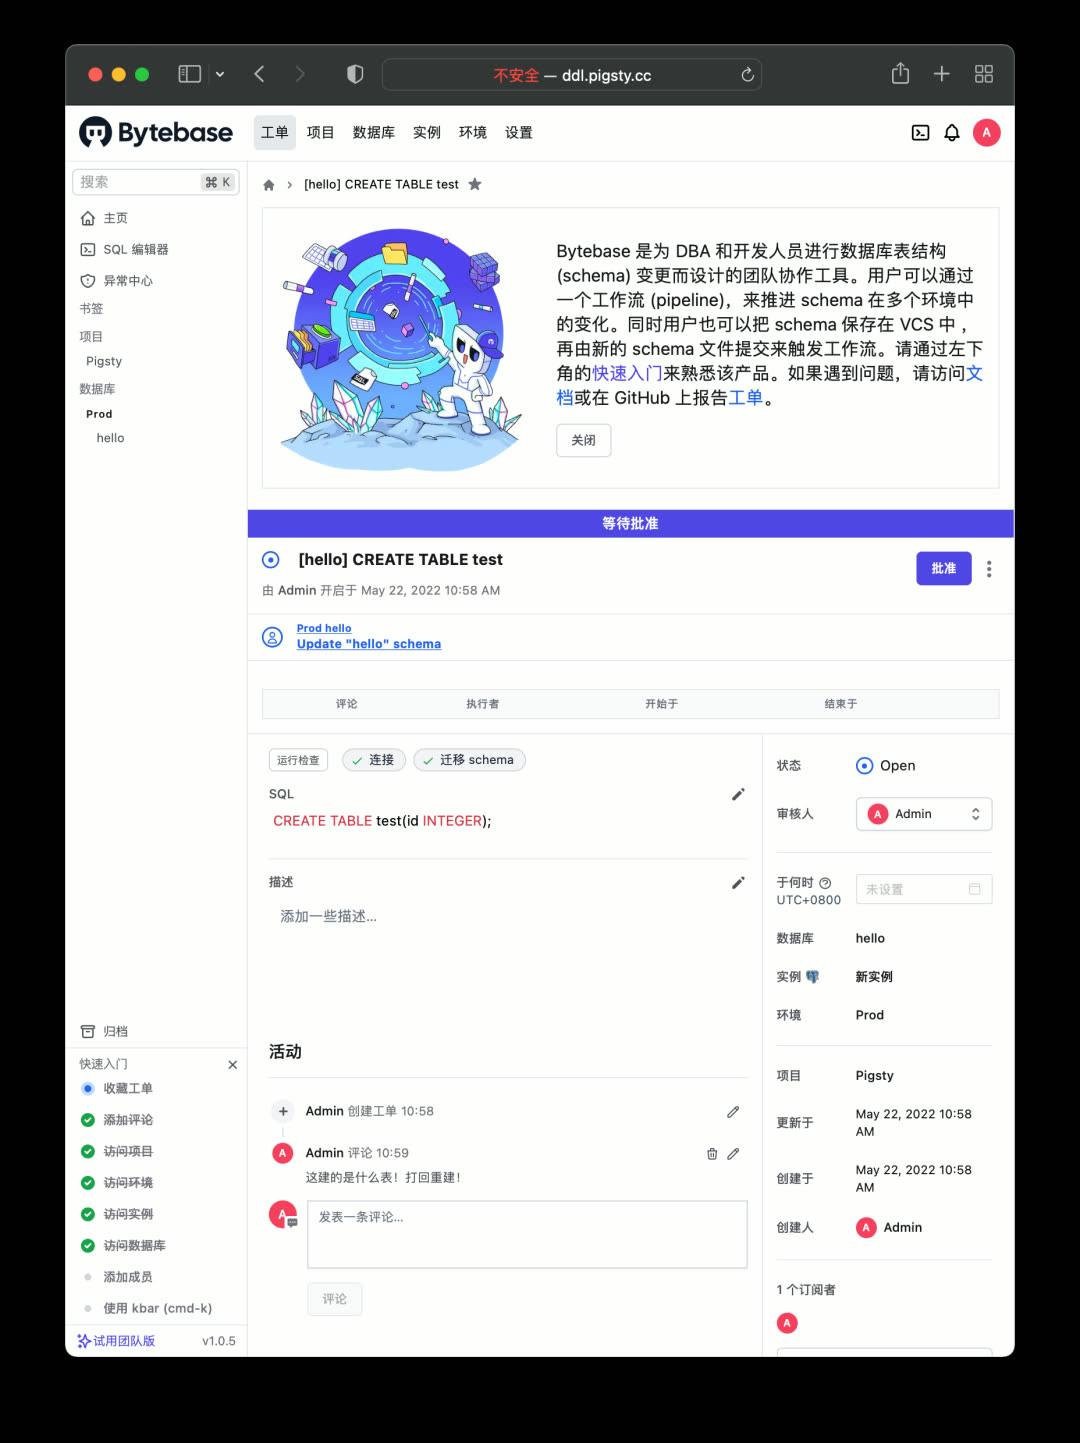
Web Client: PGWEB
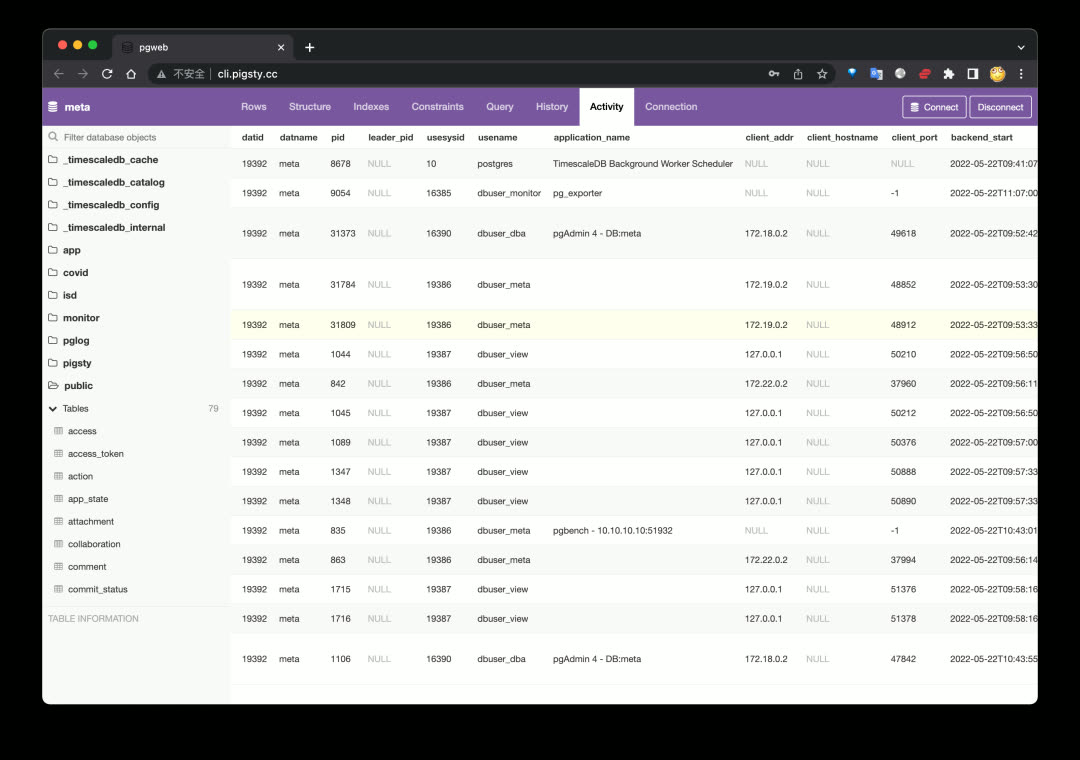
Sometimes users want to query small amounts of data from production databases using personal accounts — a browser-based PostgreSQL client works great. PGWEB can be deployed on the management node or a dedicated bastion host, with specific HBA rules allowing personal users to query production read-only instances.
Object Storage: MinIO
Object storage is a fundamental cloud service. For private deployments, you can use MinIO to quickly build your own object storage. It can store documents, images, videos, backups, with automatic redundancy and disaster recovery, exposing a standard S3-compatible API.
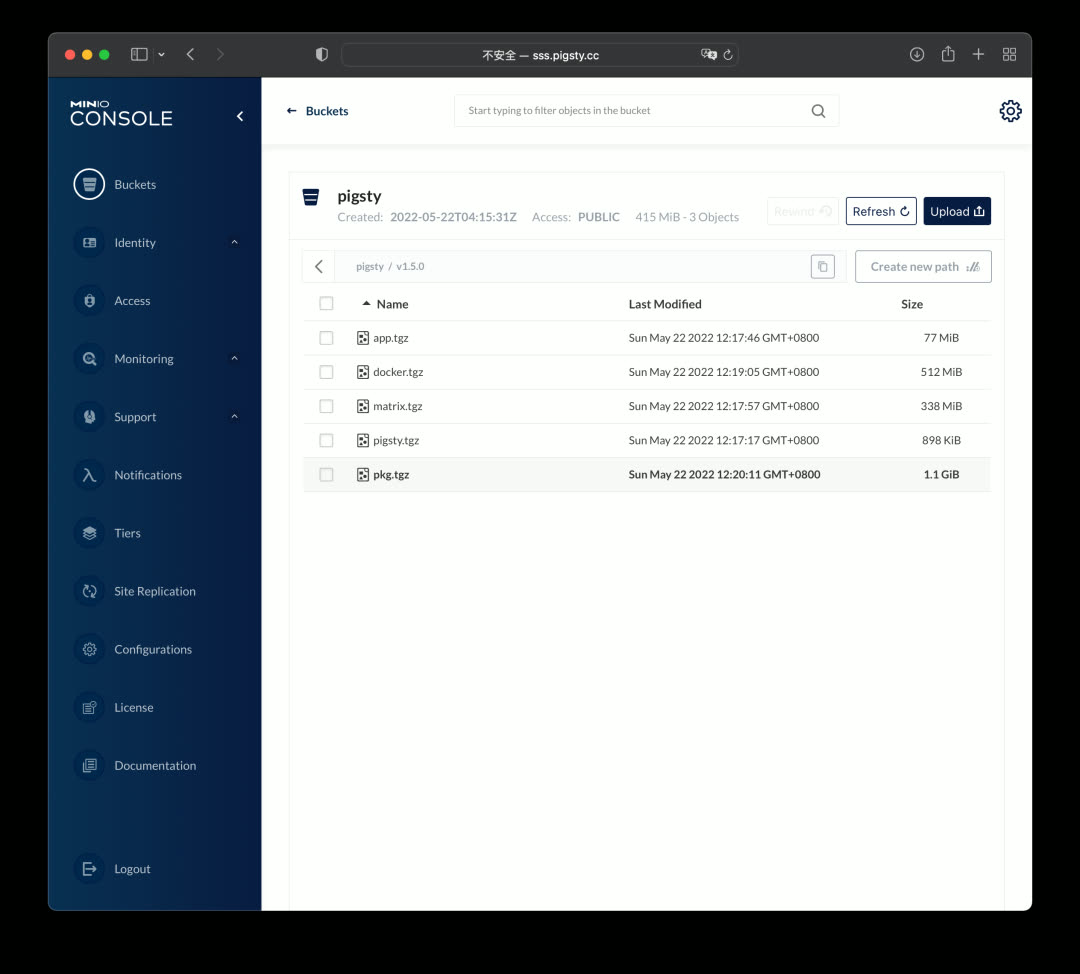
Building on MinIO, you can use JuiceFS to convert massive distributed storage into a filesystem for other services.
Data Analysis Environment: Jupyter
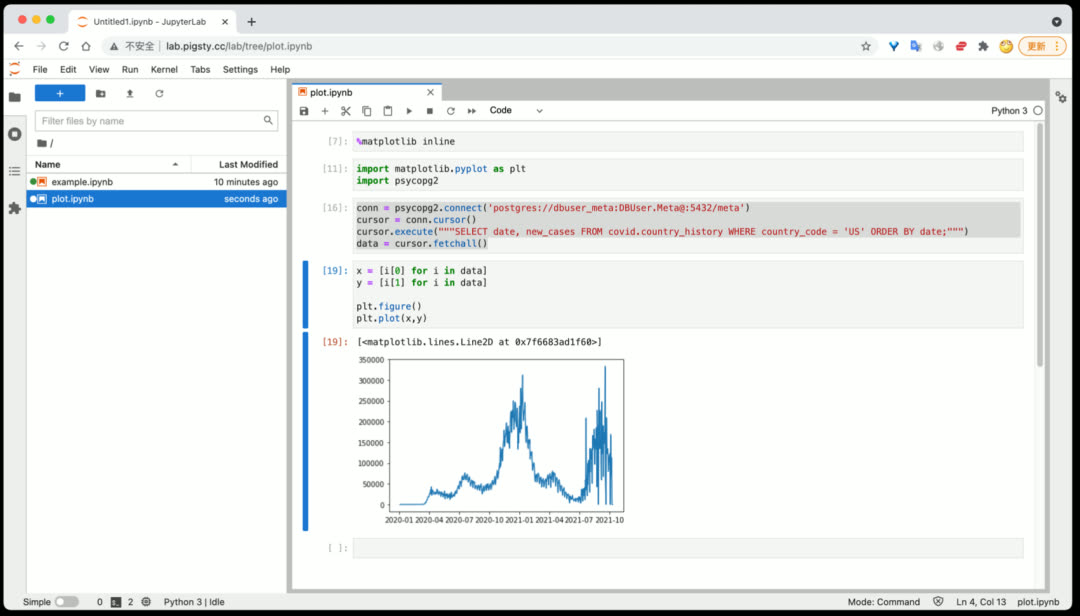
Pigsty provides a powerful data analysis tool: Jupyter Lab, allowing combined Python and SQL data processing and analysis. Jupyter Lab doesn’t run via Docker by default — it runs directly under a restricted OS user on the management node for easier database interaction.
Database Schema Reports: SchemaSPY
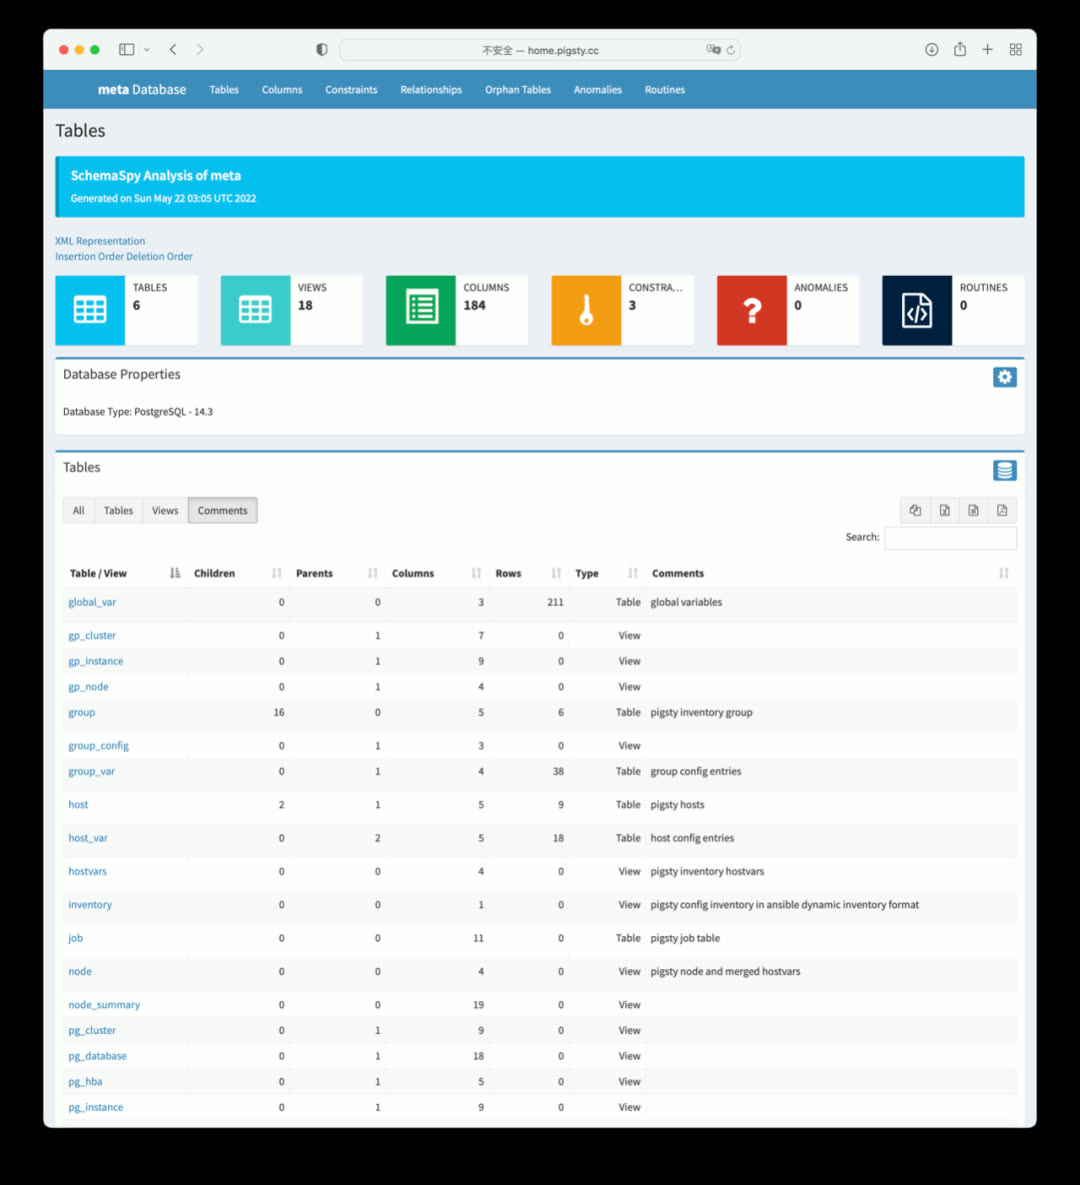
To generate detailed schema reports for a database:
Database Log Analysis Reports
To view database log summary information:
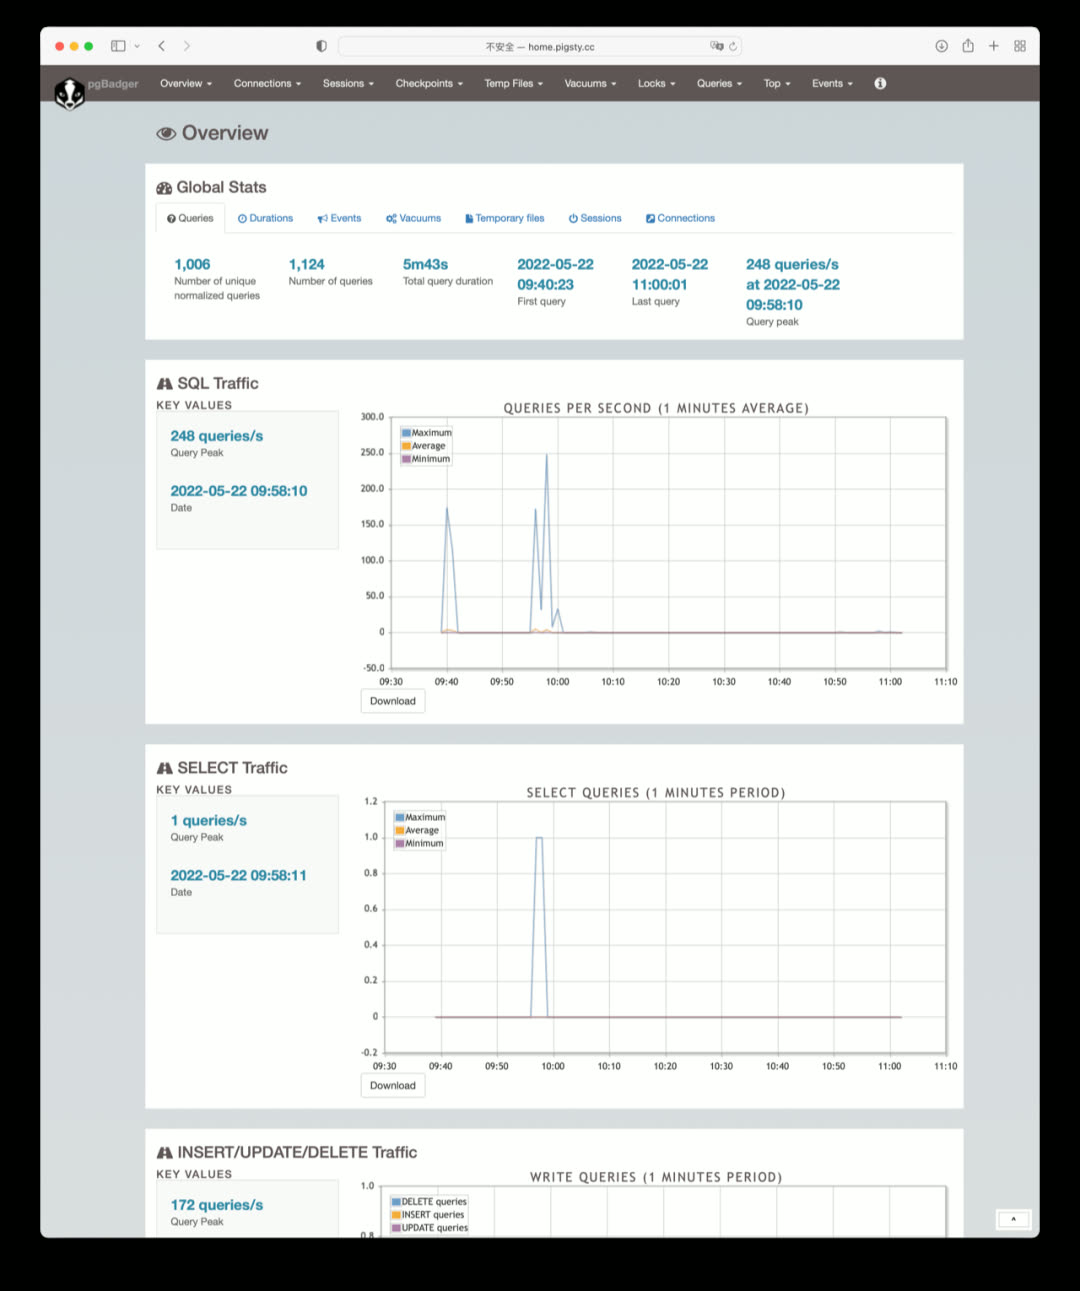
More Applications
Many well-known software applications can be launched with Pigsty + Docker:
| Application | Description |
|---|---|
| Gitlab | Open-source code hosting platform using PG |
| Habour | Open-source image registry using PG |
| Jira | Open-source project management platform using PG |
| Confluence | Open-source knowledge hosting platform using PG |
| Odoo | Open-source ERP using PG |
| Mastodon | Social network based on PG |
| Discourse | Open-source forum based on PG and Redis |
| KeyCloak | Open-source SSO single sign-on solution |
Better Cold Backups
Data failures broadly fall into two categories: hardware failures/resource exhaustion (disk failure/crash) and software defects/human errors (dropping databases/tables). Physical replication addresses the former, while delayed replicas and cold backups typically address the latter. Because erroneous deletion operations are immediately replicated to replicas, hot and warm backups cannot solve errors like DROP DATABASE or DROP TABLE — you need cold backups or delayed replicas.
In Pigsty v1.5, the cold backup mechanism was improved:
- Added scheduled tasks for daily full cold backups
- Improved delayed replica creation — just declare it and it’s automatically created
- For power users,
pg_probackupis provided as a backup solution - Built-in MinIO Docker images lay the foundation for out-of-the-box offsite disaster recovery
Scheduled Tasks
Pigsty v1.5 supports configuring scheduled tasks for nodes, including both append and overwrite modes for /etc/crontab. Basic physical cold backups, log analysis, schema dumps, garbage collection, and statistics collection can all be managed in a unified, declarative way.
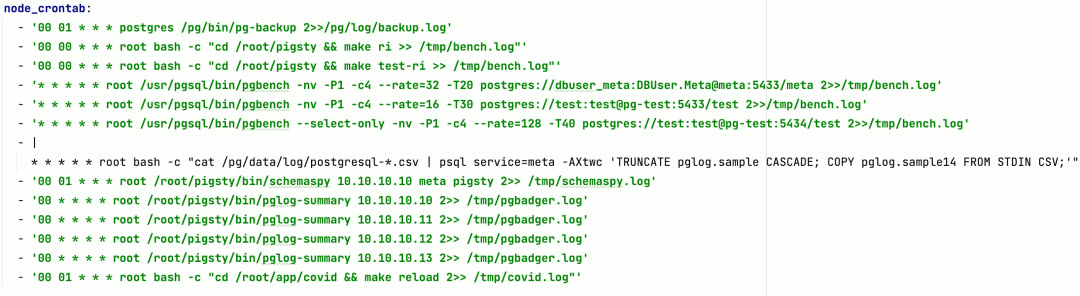
The most important is the default daily full backup at 1:00 AM. Combined with Pigsty’s default last-day WAL archive, you can restore the database to any state within the past day, providing a solid safety net for software defects and human-error-induced data loss.
Delayed Replicas
In Pigsty v1.5, creating a delayed replica no longer requires manually running patronictl edit-config to adjust cluster configuration — just declare it like this to create a delayed replica (cluster):
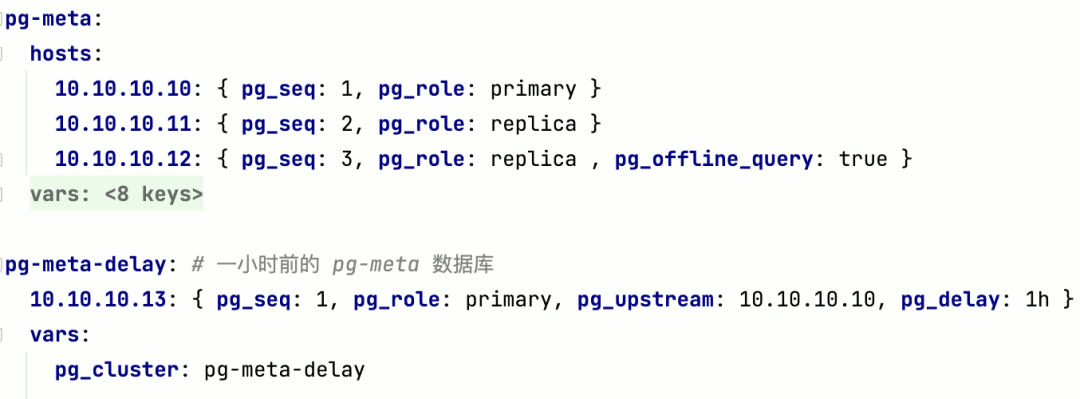
CMDB Compatibility Improvements
Pigsty has an optional CMDB, allowing you to store configuration in the default PostgreSQL database on the meta node instead of the default config file pigsty.yml.
Pigsty CMDB was first introduced in v0.8, designed only for PostgreSQL. When Pigsty started supporting Redis, Greenplum, and more database types, the original design became outdated. So in Pigsty v1.5, the CMDB was redesigned.
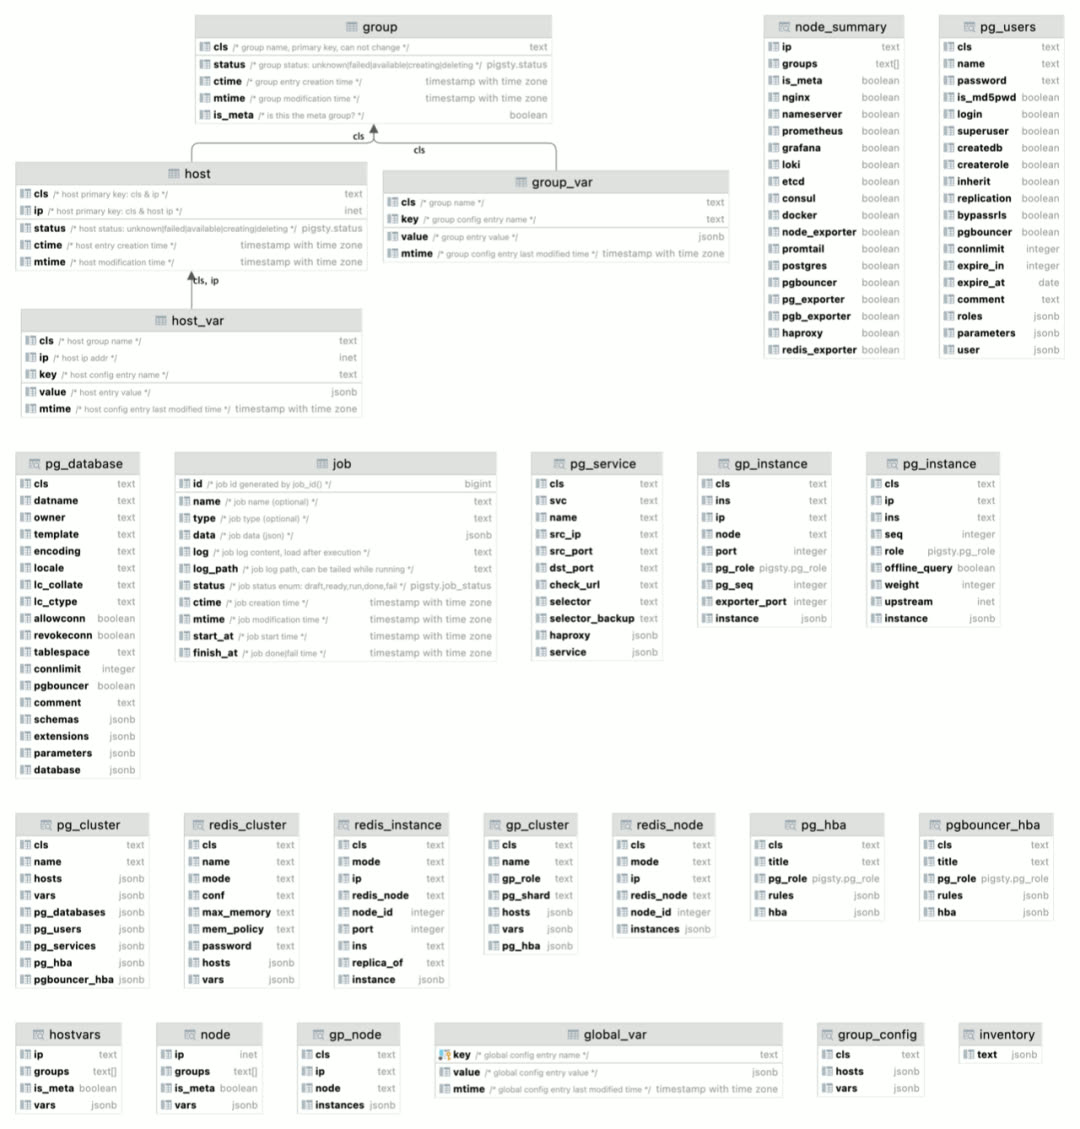
Just use bin/inventory_load to load the current config file into CMDB, and bin/inventory_cmdb to switch to CMDB mode. When using CMDB, you can view the visual configuration inventory directly from Grafana’s CMDB Overview panel:
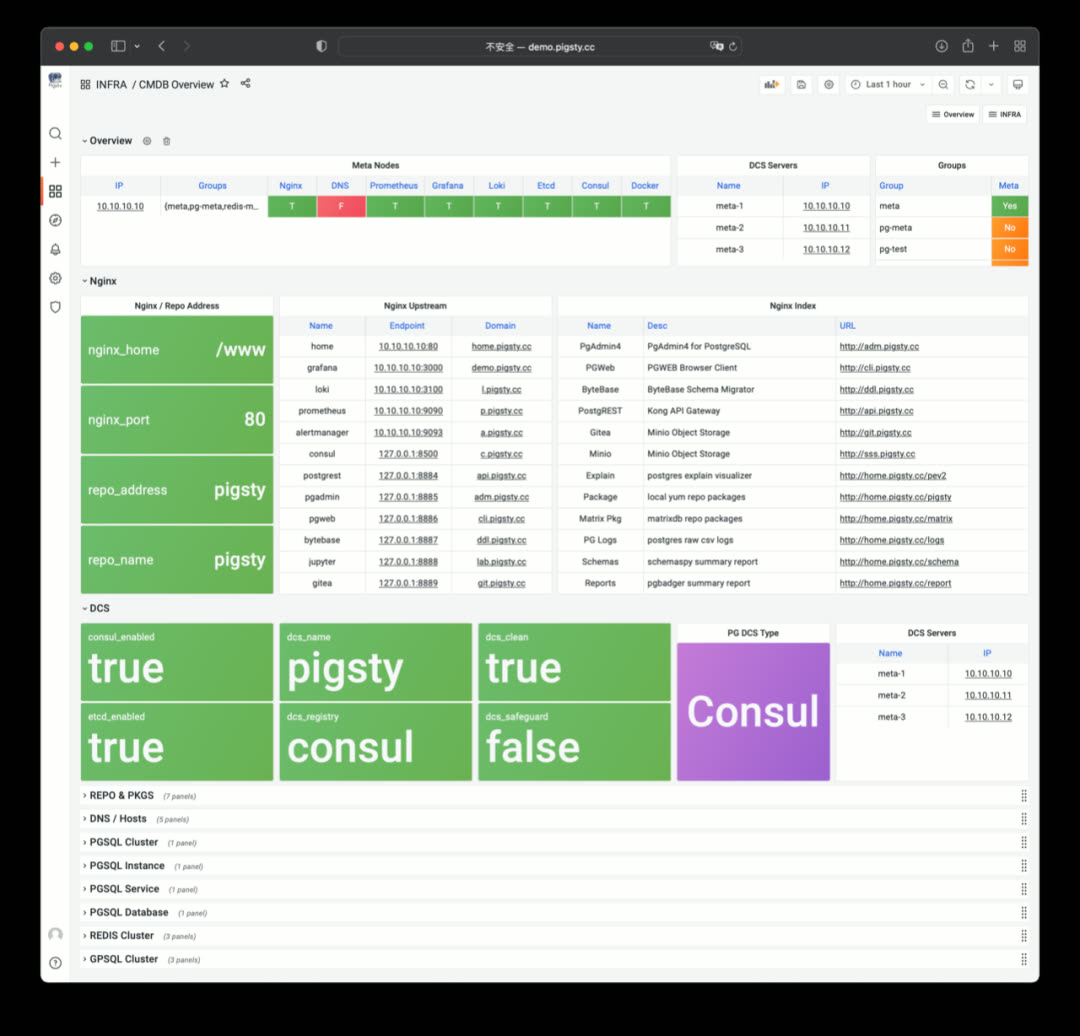
You can see PostgreSQL, Redis, and Greenplum/MatrixDB cluster member information from CMDB Overview.
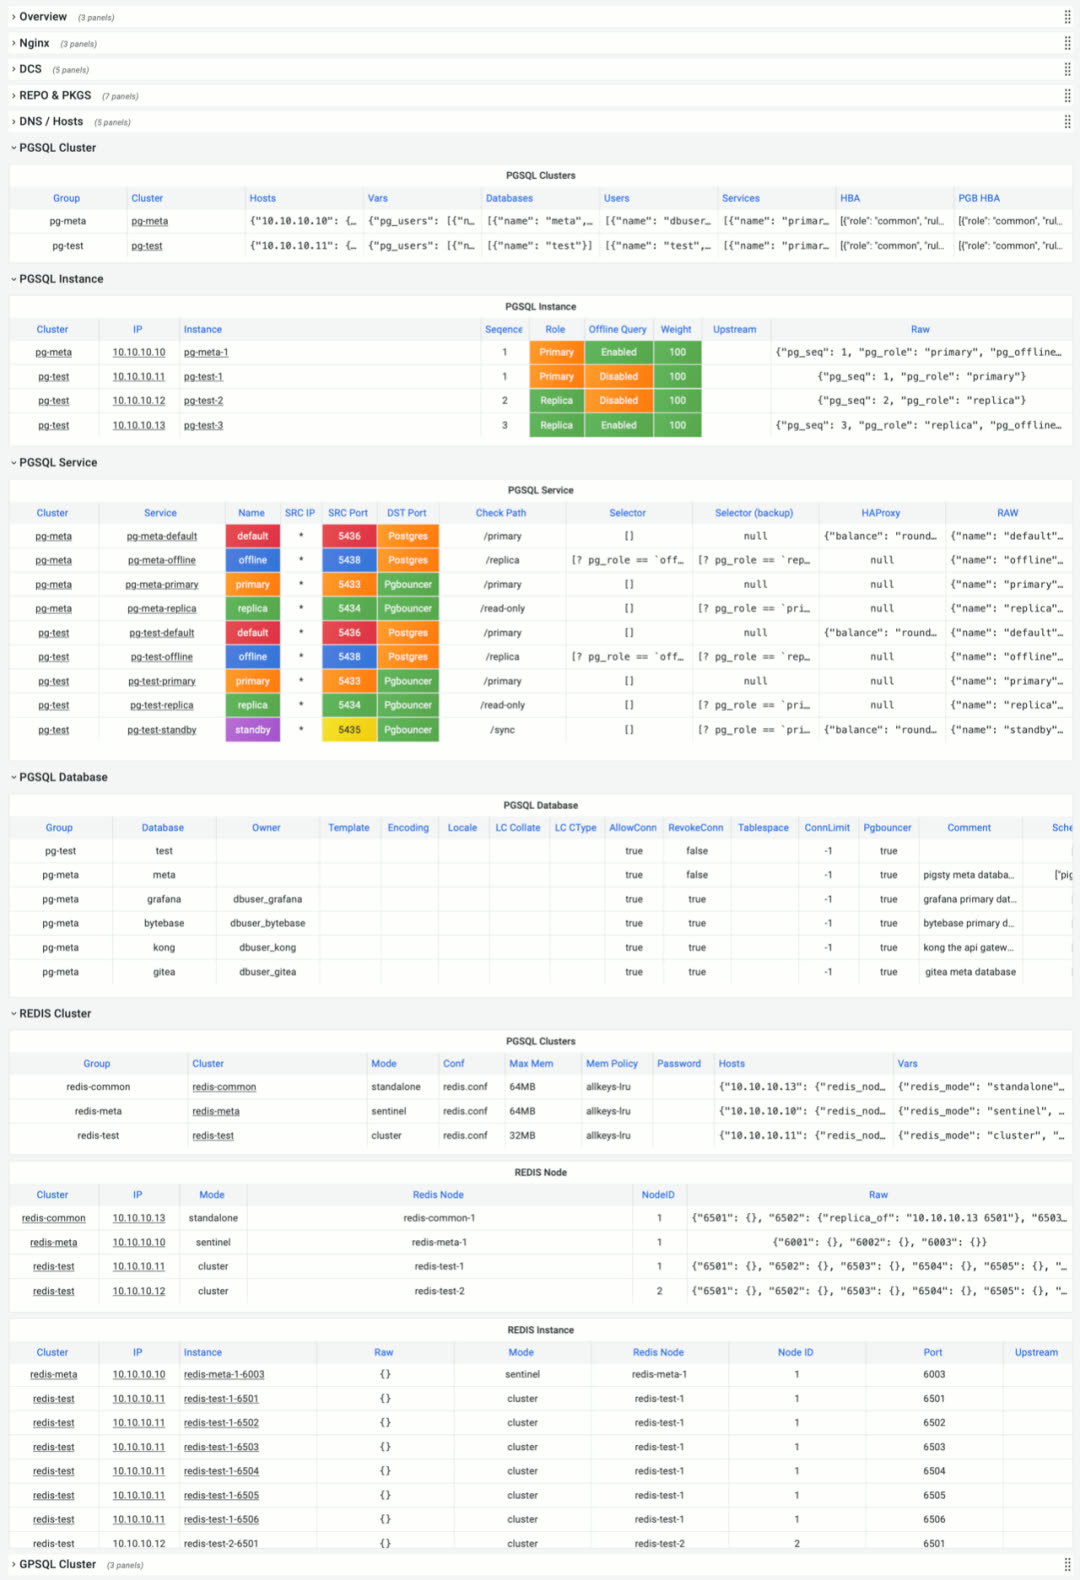
You can adjust configuration directly via SQL, or via the API exposed by PostgREST, for example creating new clusters or scaling.
PostgREST is a binary component that automatically generates REST APIs from PostgreSQL database schemas, bundled in Pigsty v1.5’s Docker image package.
It can also auto-generate API definitions via Swagger OpenAPI Spec, expose API documentation with Swagger Editor, and generate client stubs in different programming languages.
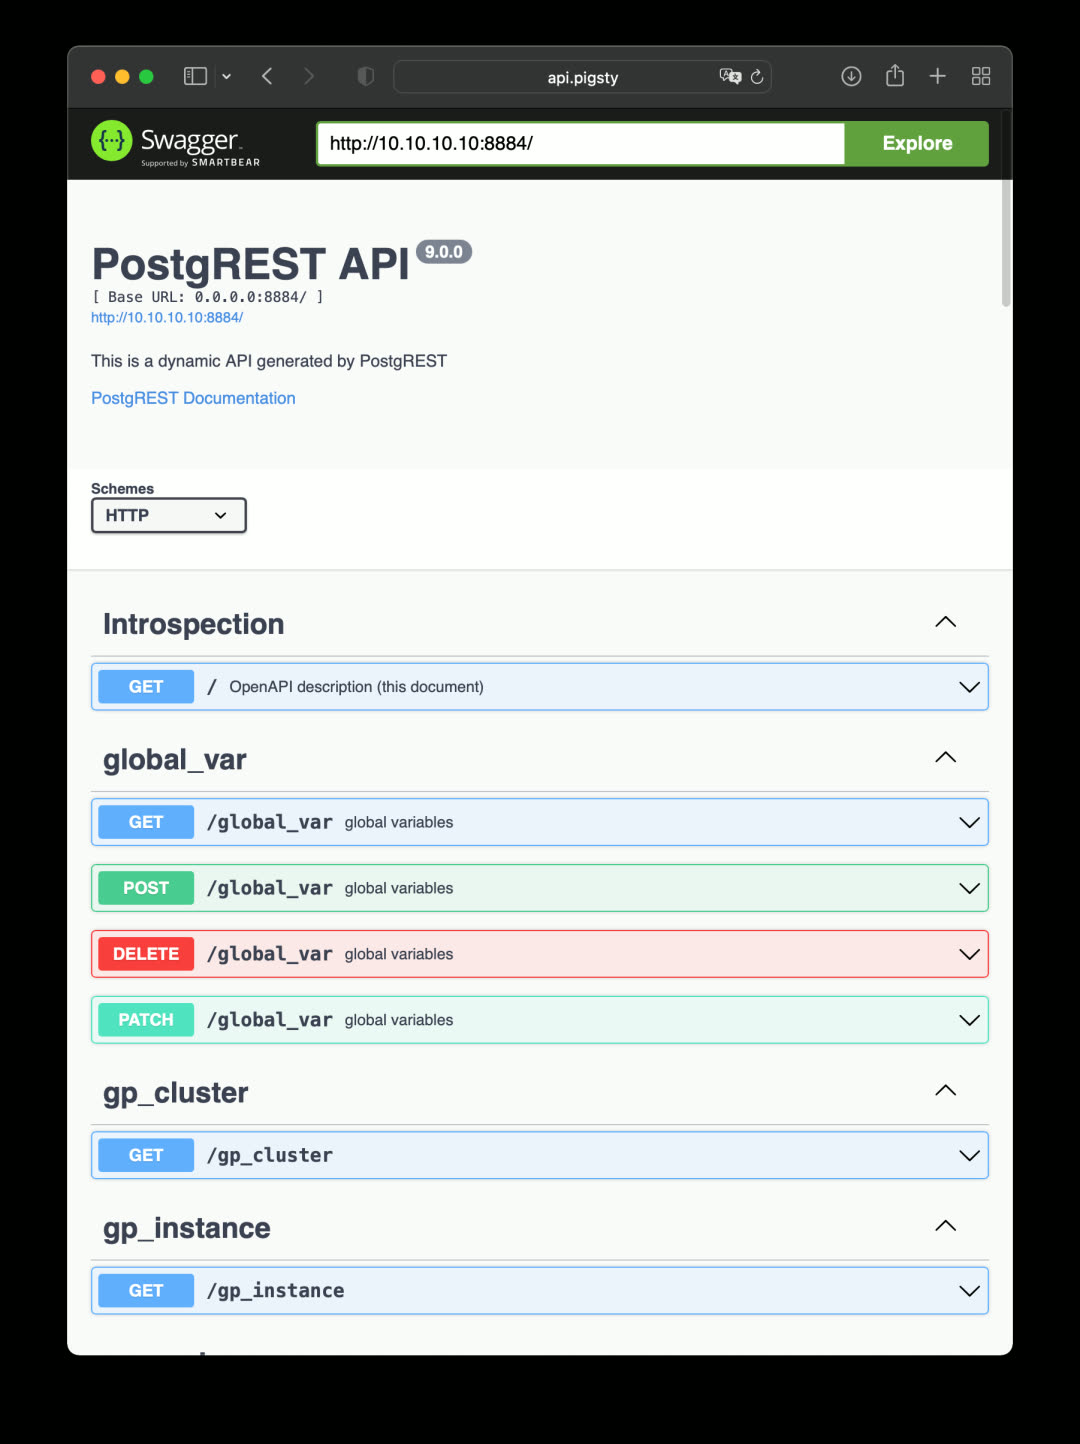
PostgREST isn’t just for exposing CMDB CRUD interfaces. If you already have a well-designed database schema, PostgREST can immediately build a backend REST API service without hand-coding tedious CRUD logic — complex logic can be exposed via stored procedures.
For more powerful API support, consider the Kong API gateway. It can turn any existing API into a full-featured API service, enabling various authentication mechanisms, automatic logging, tracing, rate limiting, and disaster recovery. Kong is built on Nginx + Lua (OpenResty), storing metadata in PostgreSQL and Redis:
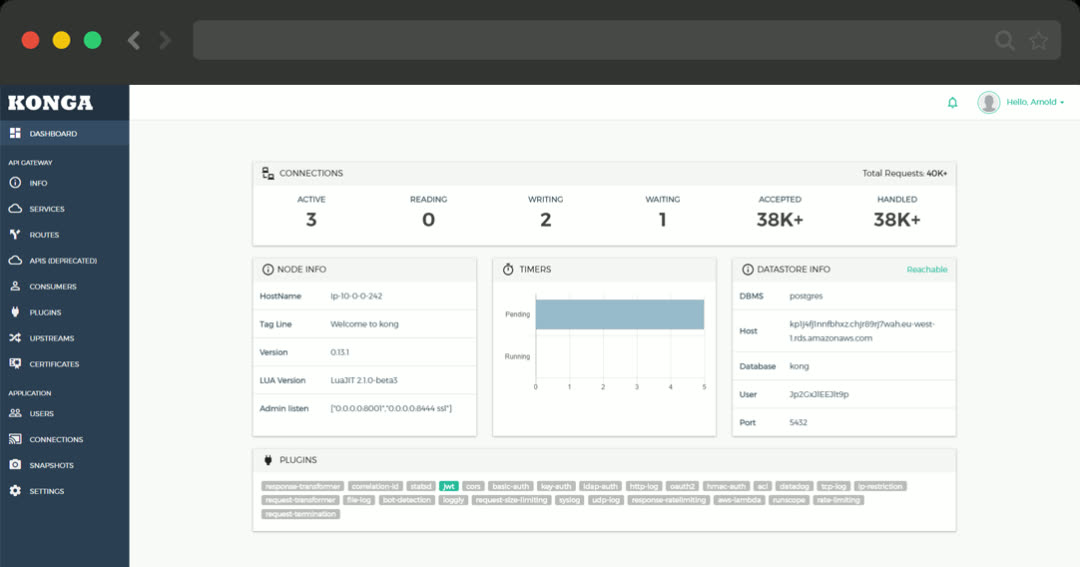
Infrastructure Monitoring
In Pigsty v1.5, infrastructure self-monitoring received major improvements: INFRA now uses the same management pattern as NODES, PGSQL, and REDIS. Infrastructure registers itself via the infra_register role, adding itself to Prometheus monitoring targets. Corresponding dashboards were added to Grafana.
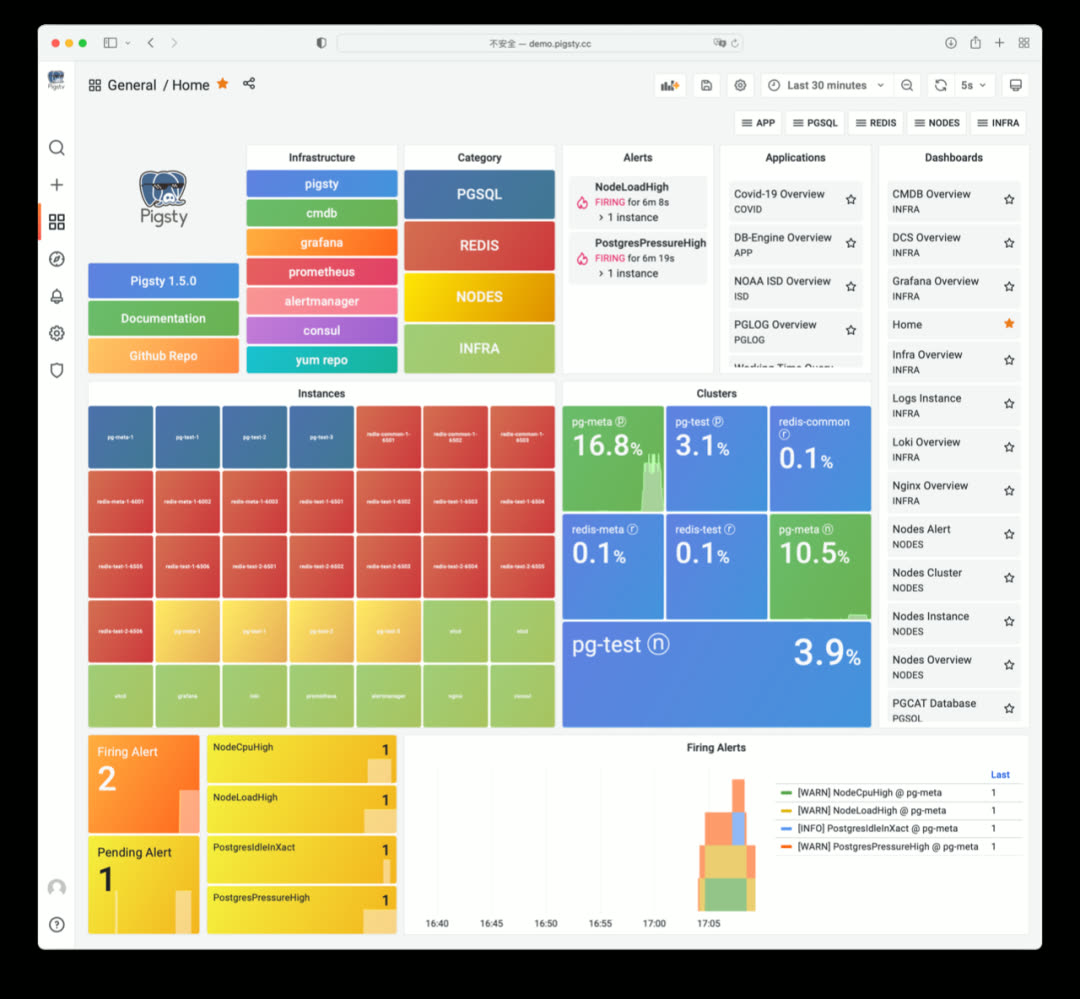
In Pigsty v1.5’s Home dashboard, infrastructure appears as light-green components, listed alongside NODES, REDIS, and PGSQL instances. Additionally, Infra services register to Service Registry (Consul) and can be automatically managed via service discovery.
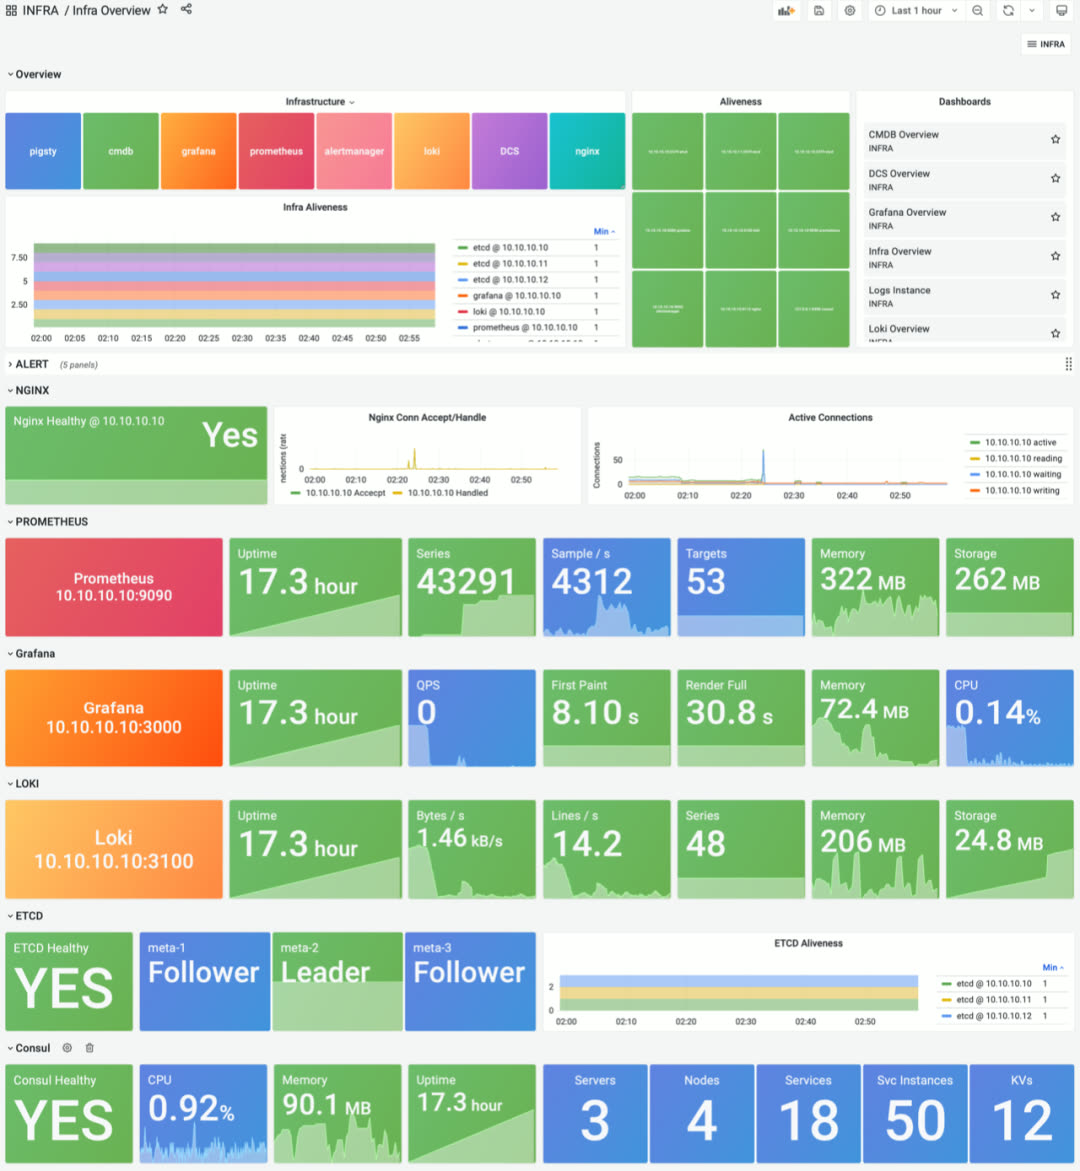
INFRA Overview provides basic status and quick navigation for all infrastructure components
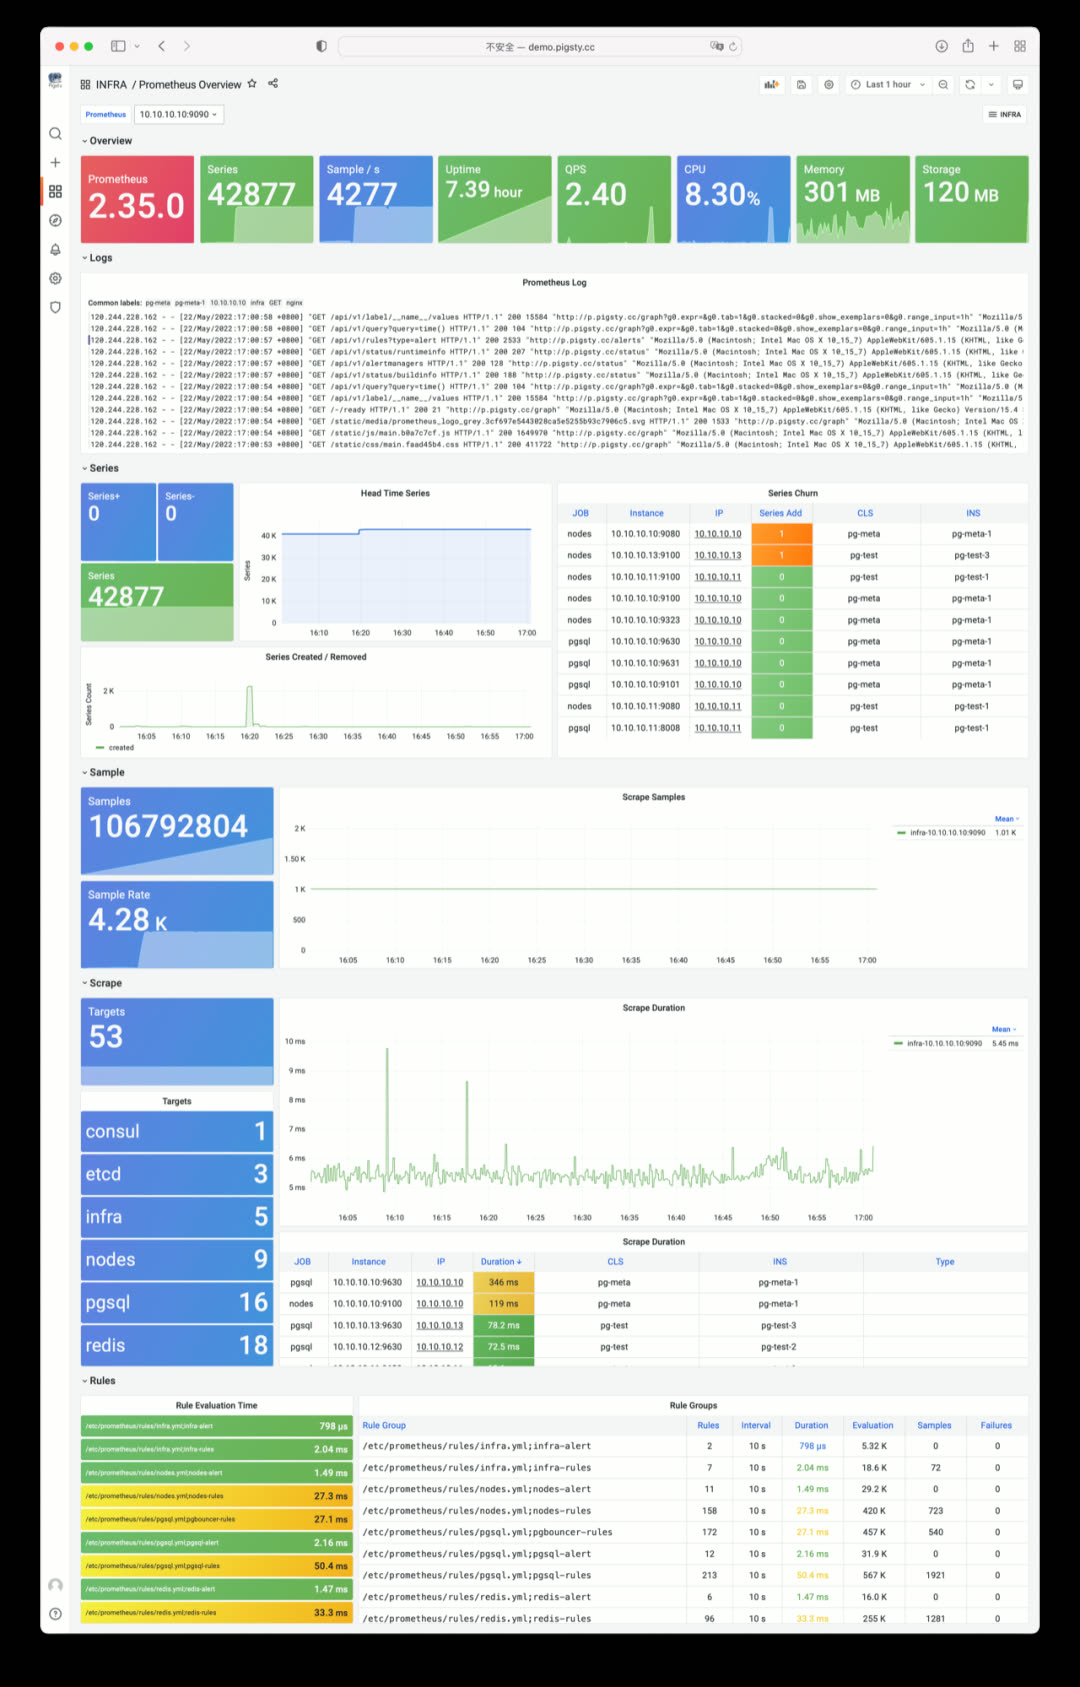
Prometheus Overview: time-series database self-monitoring
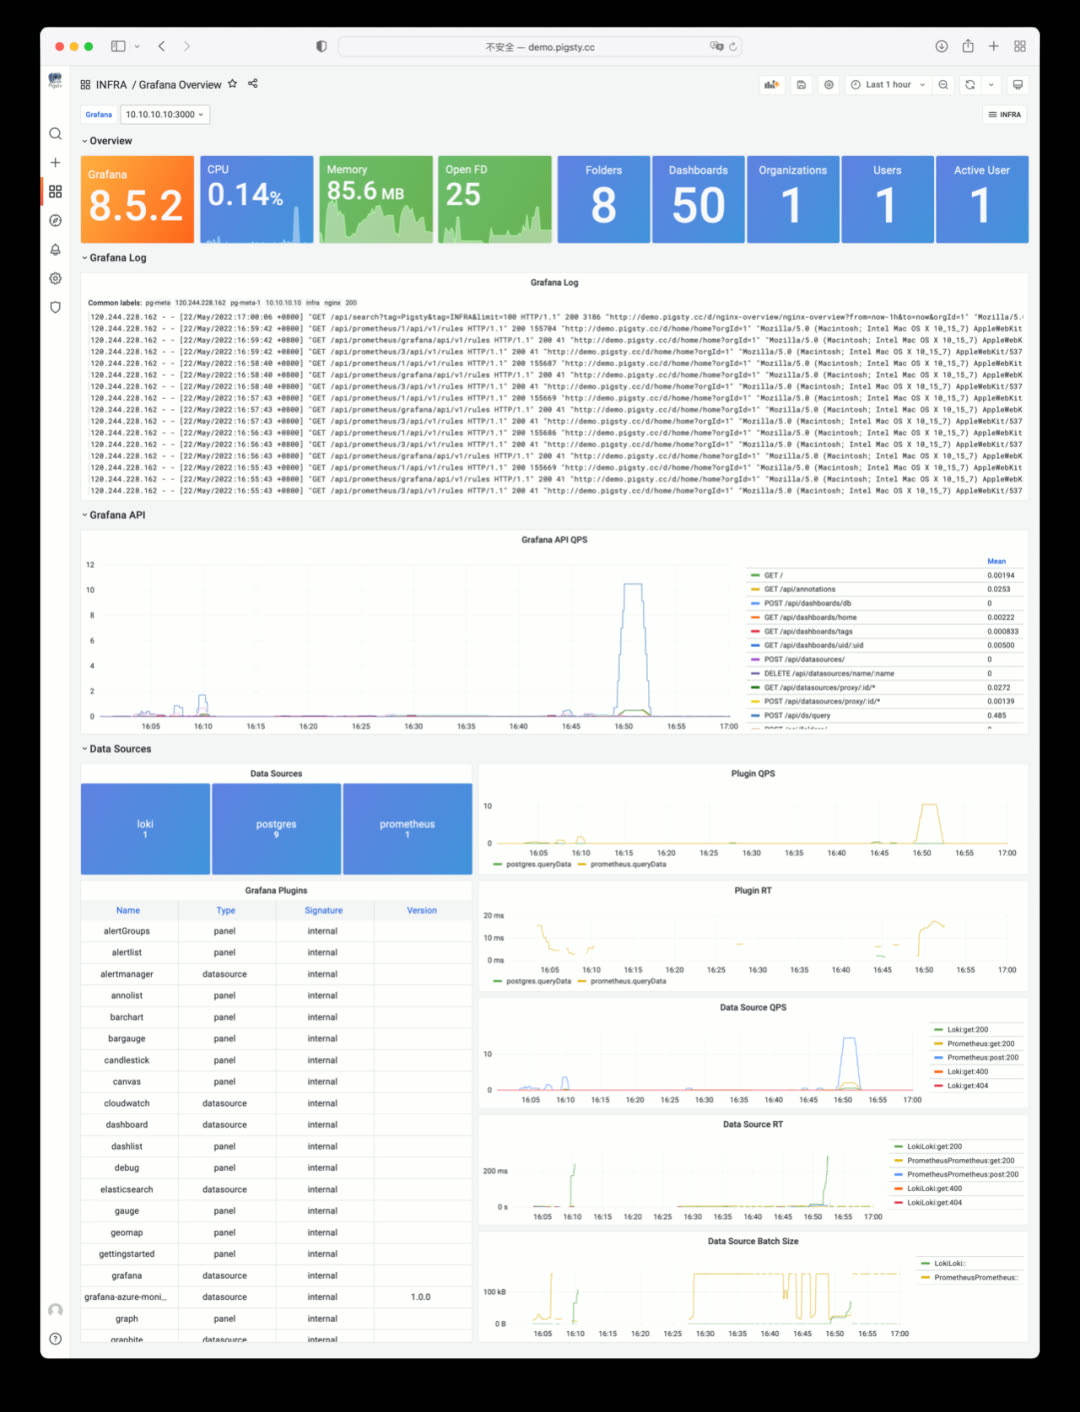
Grafana Overview: monitoring dashboard self-monitoring
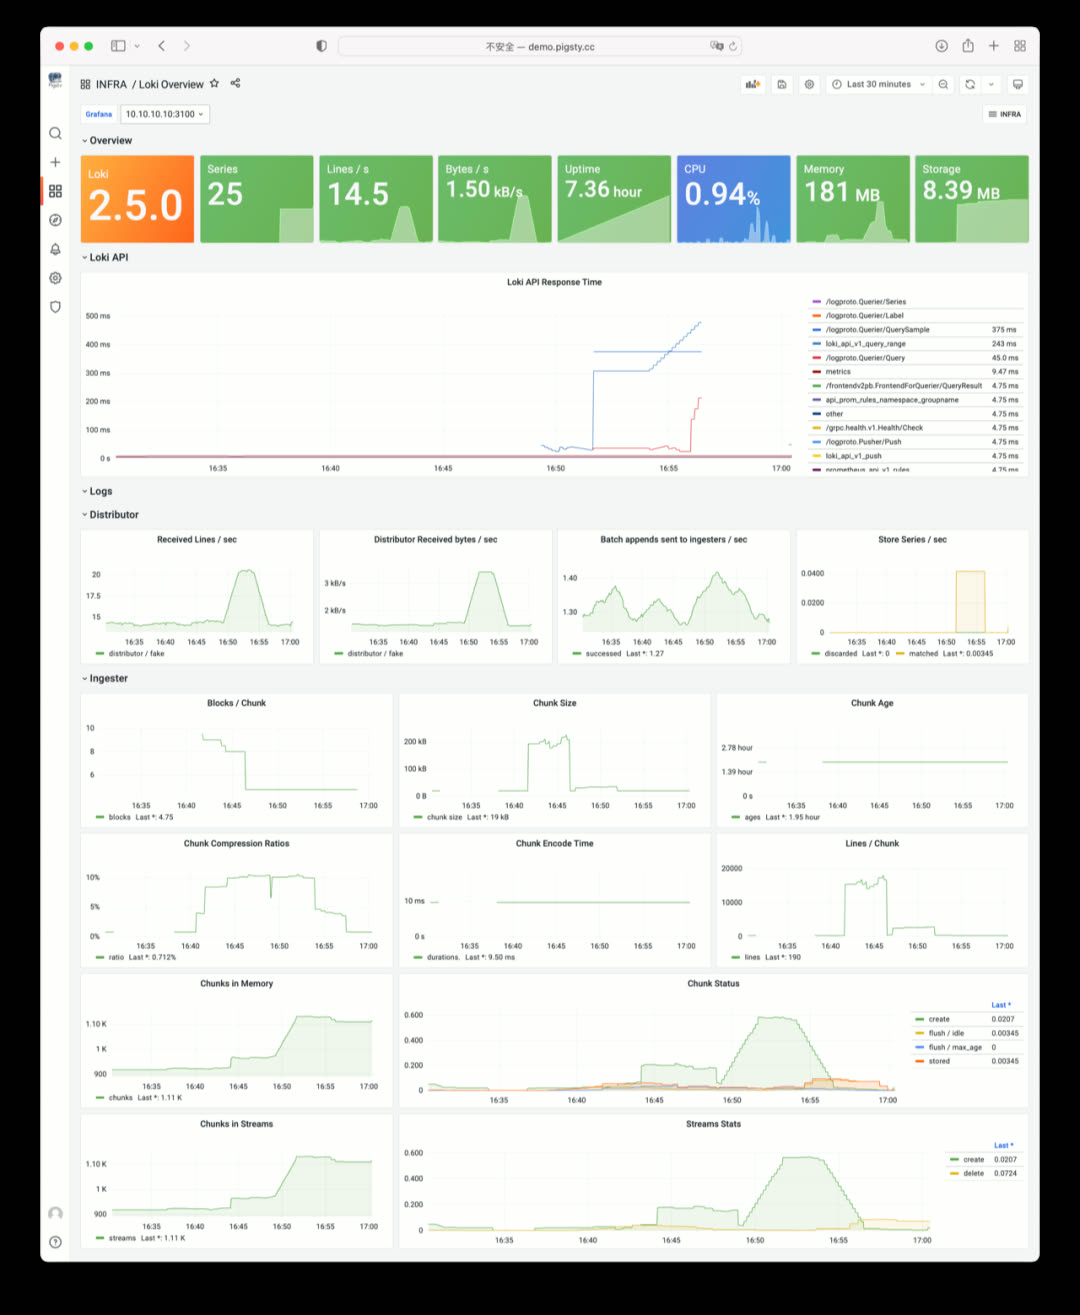
Loki Overview: log collection component self-monitoring
ETCD as DCS
In Pigsty v1.5, you can use ETCD as an alternative to Consul for PostgreSQL high-availability DCS.
Compared to Consul, ETCD lacks service discovery, built-in DNS, health checks, and an out-of-the-box UI, but ETCD requires no agent, is simpler to deploy, has higher popularity thanks to the Kubernetes ecosystem, has one fewer failure point than Consul, and offers better metric observability.
Just specify pg_dcs_type: etcd to use ETCD as DCS. You can also use both Consul and ETCD simultaneously — for example, ETCD for DCS and Consul for service discovery.
Pigsty v1.5 provides an out-of-the-box monitoring dashboard for ETCD and Consul: DCS Overview
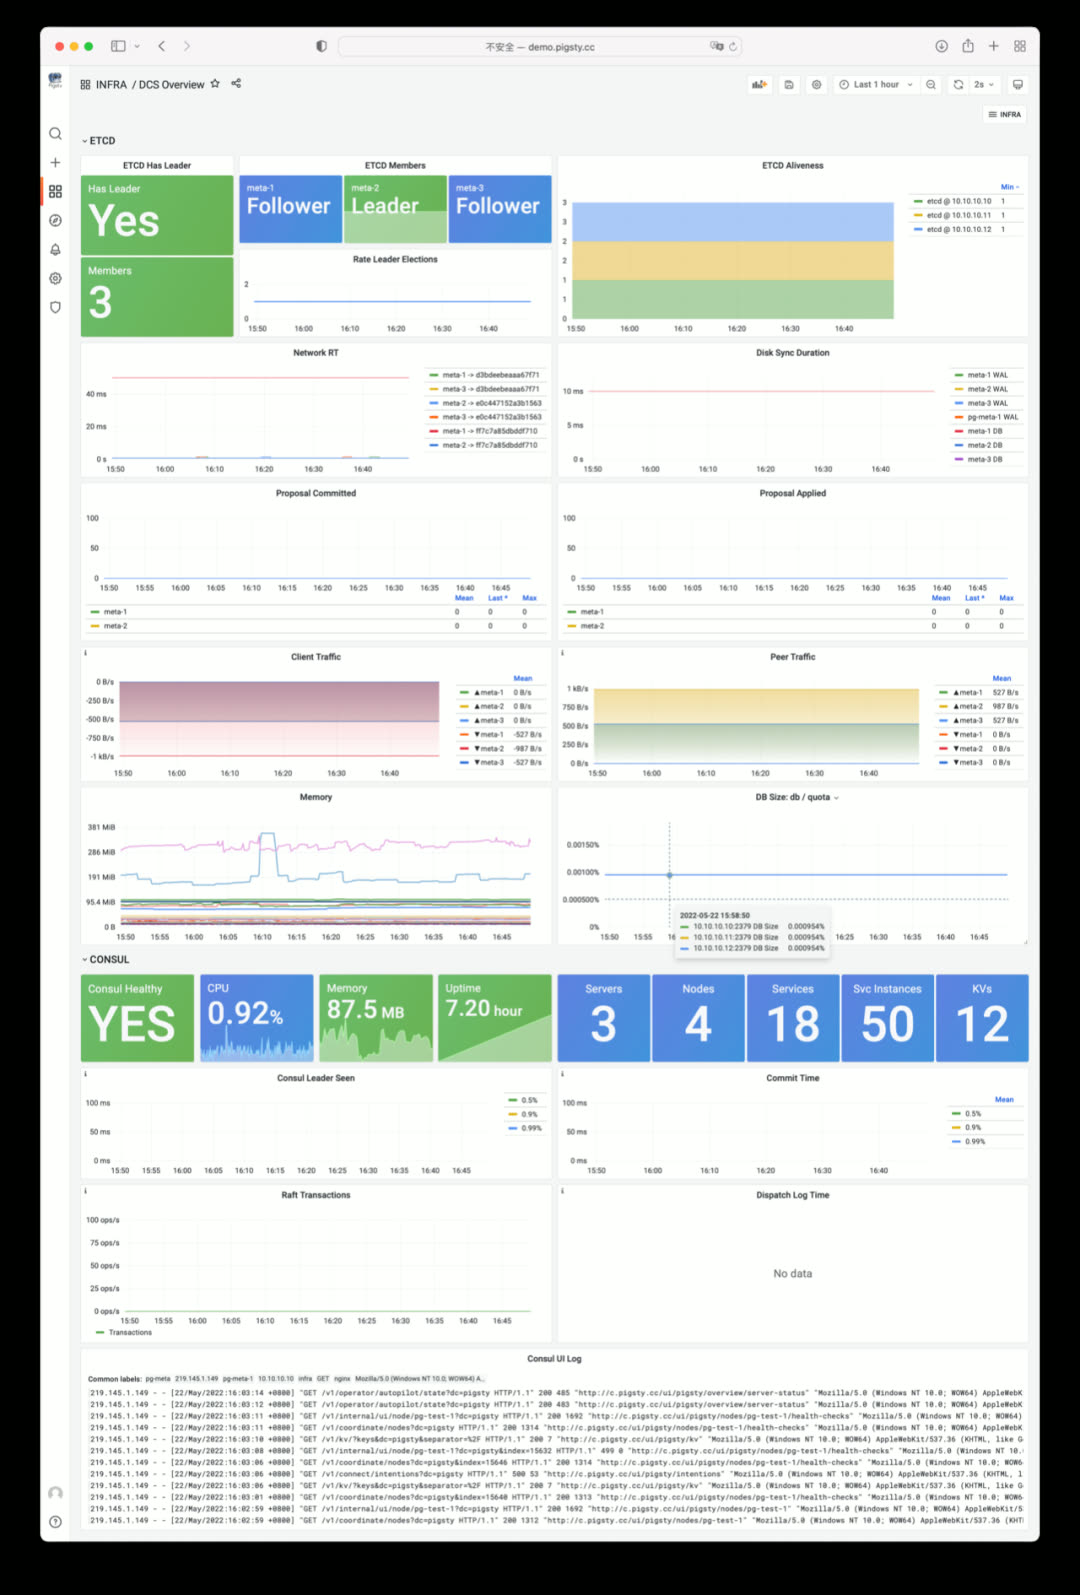
Currently, ETCD as DCS is a minimum viable implementation without CA certificates and TLS support — this will be added in a future security hardening update.
Better Log Collection and Visualization
In Pigsty v1.5, separate access logs are enabled by default for each upstream service, with all fields parsed by Loki for direct analysis. If you have a website on Pigsty, you can immediately do interactive log traffic analysis and statistics.
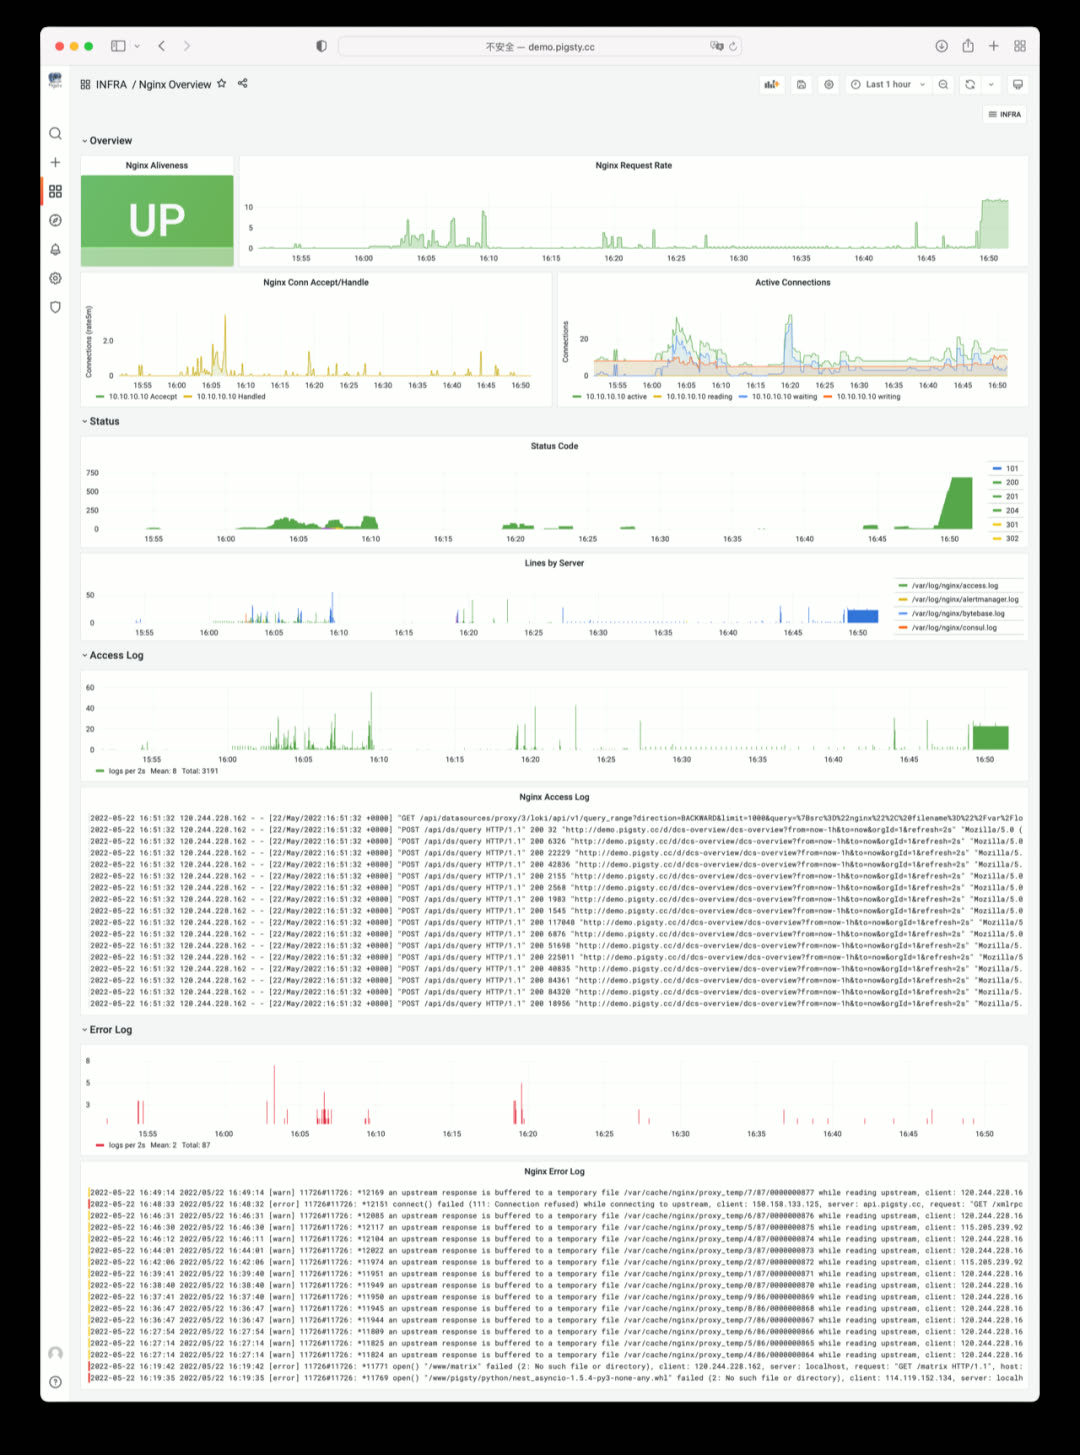
NGINX Overview: showing Nginx metrics and logs
v1.5.0 Release Notes
Highlights
- Complete Docker support: enabled by default on meta node with many out-of-the-box software templates: bytebase, pgadmin, pgweb, postgrest, minio, etc.
- Infrastructure self-monitoring: Nginx, ETCD, Consul, Prometheus, Grafana, Loki self-monitoring
- CMDB upgrade: compatibility improvements, supports Redis cluster/Greenplum cluster metadata, config file visualization
- Service discovery improvements: Consul can auto-discover all monitoring targets and integrate with Prometheus
- Better cold backup support: default scheduled backup tasks,
pg_probackupbackup tool, one-click delayed replica creation - ETCD can now be used as PostgreSQL/Patroni DCS service, as an alternative to Consul
- Redis playbook/role improvements: now allows init and remove operations for individual Redis instances, not just entire Redis nodes
Monitoring System
Dashboards
- CMDB Overview: visualize Pigsty CMDB Inventory
- DCS Overview: view Consul and ETCD cluster monitoring metrics
- Nginx Overview: view Pigsty Web access metrics and logs
- Grafana Overview: Grafana self-monitoring
- Prometheus Overview: Prometheus self-monitoring
- INFRA Dashboard redesigned to reflect overall infrastructure status
Monitoring Architecture
- Now allows Consul for service discovery (when all services are registered to Consul)
- All Infra components now enable self-monitoring and register to Prometheus and Consul via
infra_registerrole - Metrics collector pg_exporter updated to v0.5.0, new features:
scaleanddefault, allowing metric multiplication factors and default values pg_bgwriter,pg_wal,pg_query,pg_db,pgbouncer_stattime-related metrics now uniformly scaled to seconds from milliseconds/microseconds- Related counter metrics in
pg_tablenow have default value0instead ofNaN pg_classmetrics collector removed by default, related metrics added topg_tableandpg_indexcollectorspg_table_sizemetrics collector now enabled by default with 300-second cache time
Deployment
- New optional package
docker.tgzwith common app images: Pgadmin, Pgweb, Postgrest, ByteBase, Kong, Minio, etc. - New ETCD role: automatically deploys ETCD service on DCS Server nodes and integrates with monitoring
pg_dcs_typespecifies DCS service for PG high-availability: Consul (default), ETCD (alternative)node_crontabparameter for configuring node scheduled tasks like database backups, VACUUM, statistics collection- New
pg_checksumoption: when enabled, database cluster enables data checksums (previously onlycrittemplate enabled by default) - New
pg_delayoption: when instance is Standby Cluster Leader, this parameter configures a delayed replica - New
pg_probackuppackage, default rolereplicatornow has backup-related function permissions - Redis deployment split into two parts: Redis node and Redis instance,
redis_portparameter controls specific instances - Loki and Promtail now installed via
fpm-built RPM packages - DCS3 config template now uses a 3-node
pg-metacluster with a single-node delayed replica
Software Upgrades
- PostgreSQL upgraded to 14.3
- Redis upgraded to 6.2.7
- PG Exporter upgraded to 0.5.0
- Consul upgraded to 1.12.0
- vip-manager upgraded to v1.0.2
- Grafana upgraded to v8.5.2
- Loki & Promtail upgraded to v2.5.0, using fpm packaging
Bug Fixes
- Fixed Loki and Promtail default config filename issues
- Fixed Loki and Promtail environment variable expansion issues
- Complete English documentation translation and revision; documentation JS resources now served locally, no internet access required
API Changes
New Parameters
node_data_dir: Main data mount path, created if doesn’t existnode_crontab_overwrite: Overwrite/etc/crontabinstead of appendingnode_crontab: Node crontab content to append or overwritenameserver_enabled: Enable nameserver on this infra node?prometheus_enabled: Enable prometheus on this infra node?grafana_enabled: Enable grafana on this infra node?loki_enabled: Enable loki on this infra node?docker_enable: Enable docker on this infra node?consul_enable: Enable consul server/agent?etcd_enable: Enable etcd server/client?pg_checksum: Enable pg cluster data checksums?pg_delay: Application delay when backup cluster leader replays replication
Parameter Redesign
*_clean is now a boolean parameter for cleaning existing instances during init.
*_safeguard is also a boolean parameter to prevent cleaning running instances during any playbook execution.
pg_exists_action->pg_cleanpg_disable_purge->pg_safeguarddcs_exists_action->dcs_cleandcs_disable_purge->dcs_safeguard
Parameter Renames
node_ntp_config->node_ntp_enablednode_admin_setup->node_admin_enablednode_admin_pks->node_admin_pk_listnode_dns_hosts->node_etc_hosts_defaultnode_dns_hosts_extra->node_etc_hostsnode_dns_server->node_dns_methodnode_local_repo_url->node_repo_local_urlsnode_packages->node_packages_defaultnode_extra_packages->node_packagesnode_packages_meta->node_packages_metanode_meta_pip_install->node_packages_meta_pipnode_sysctl_params->node_tune_paramsapp_list->nginx_indexesgrafana_plugin->grafana_plugin_methodgrafana_cache->grafana_plugin_cachegrafana_plugins->grafana_plugin_listgrafana_git_plugin_git->grafana_plugin_githaproxy_admin_auth_enabled->haproxy_auth_enabledpg_shared_libraries->pg_libsdcs_type->pg_dcs_type
v1.5.1 Release Notes
Highlights
IMPORTANT: Fixed the issue where CREATE INDEX|REINDEX CONCURRENTLY in PG14.0-14.3 could corrupt index data.
Pigsty v1.5.1 upgrades the default PostgreSQL version to 14.4. Strongly recommend updating ASAP.
Software Upgrades
- postgres upgraded to 14.4
- haproxy upgraded to 2.6.0
- grafana upgraded to 9.0.0
- prometheus upgraded to 2.36.0
- patroni upgraded to 2.1.4
Bug Fixes
- Fixed TYPO in
pgsql-migration.yml - Removed PID config item from HAProxy configuration
- Removed i686 packages from default packages
- Enabled all Systemd Redis Services by default
- Enabled all Systemd Patroni Services by default
API Changes
grafana_databaseandgrafana_pgurlmarked as deprecated API, will be removed in future versions
New Applications
- wiki.js: Build local Wikipedia with Postgres
- FerretDB: Provide MongoDB API using Postgres
2.2 - Pigsty v1.4: Modular Architecture, MatrixDB Data Warehouse Support
Originally published on VONNG.

Pigsty v1.4 is officially released! A brand new modular architecture: four built-in modules INFRA, NODES, PGSQL, REDIS can be used independently and freely combined; new MatrixDB time-series data warehouse deployment and monitoring support; global CDN acceleration for downloads.
GitHub stars are taking off!

Modular Architecture
The core feature of Pigsty v1.4 is a major refactor of the underlying architecture. In v1.4, the entire system decouples into 4 independent modules that can be maintained separately and freely combined:
| Module | Purpose |
|---|---|
| INFRA | Infrastructure: monitoring/alerting/visualization/logging/DNS/NTP and other shared components |
| NODES | Host node management module |
| PGSQL | PostgreSQL database deployment and management module |
| REDIS | Redis database deployment and management module |
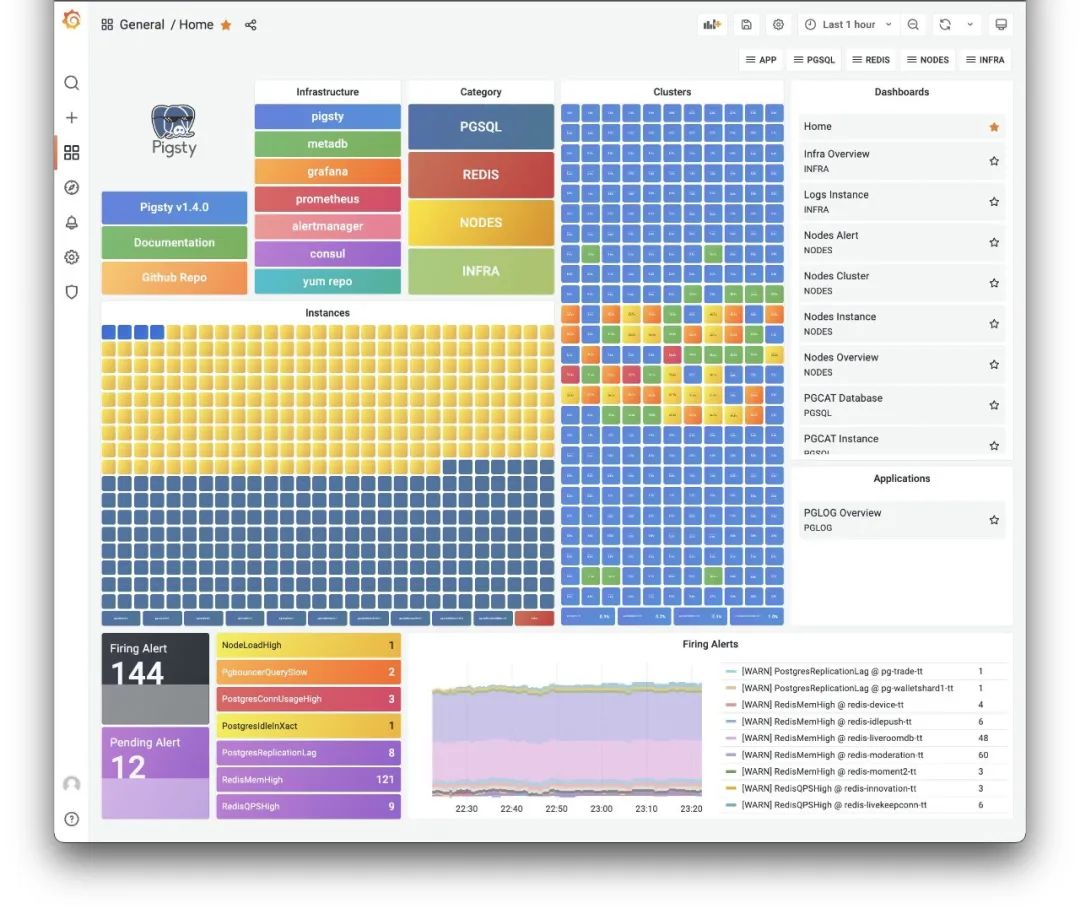
The new Pigsty v1.4 monitoring home dashboard
Typical deployment scenarios:
-
Single-node PostgreSQL distribution: Install INFRA + NODES + PGSQL modules sequentially on one machine to get a ready-to-use, self-monitoring database instance.
-
Production-grade host monitoring system: Install the INFRA module on one machine, install the NODES module on all monitored nodes. All host nodes get configured with software repos, packages, DNS, NTP, node monitoring, log collection, DCS Agent — everything needed for production.
-
Massive PostgreSQL clusters: Add the PGSQL module on nodes managed by Pigsty. One-click deploy various PostgreSQL clusters: single instance, primary with N replicas HA cluster, synchronous cluster, quorum-commit sync cluster, clusters with offline ETL roles, standby clusters for disaster recovery, delayed replication clusters, Citus distributed clusters, TimescaleDB clusters, MatrixDB data warehouse clusters.
-
Redis clusters: Add the REDIS module on Pigsty-managed nodes. Future database modules (like KAFKA, MINIO, MYSQL) can be added to Pigsty in similar fashion.
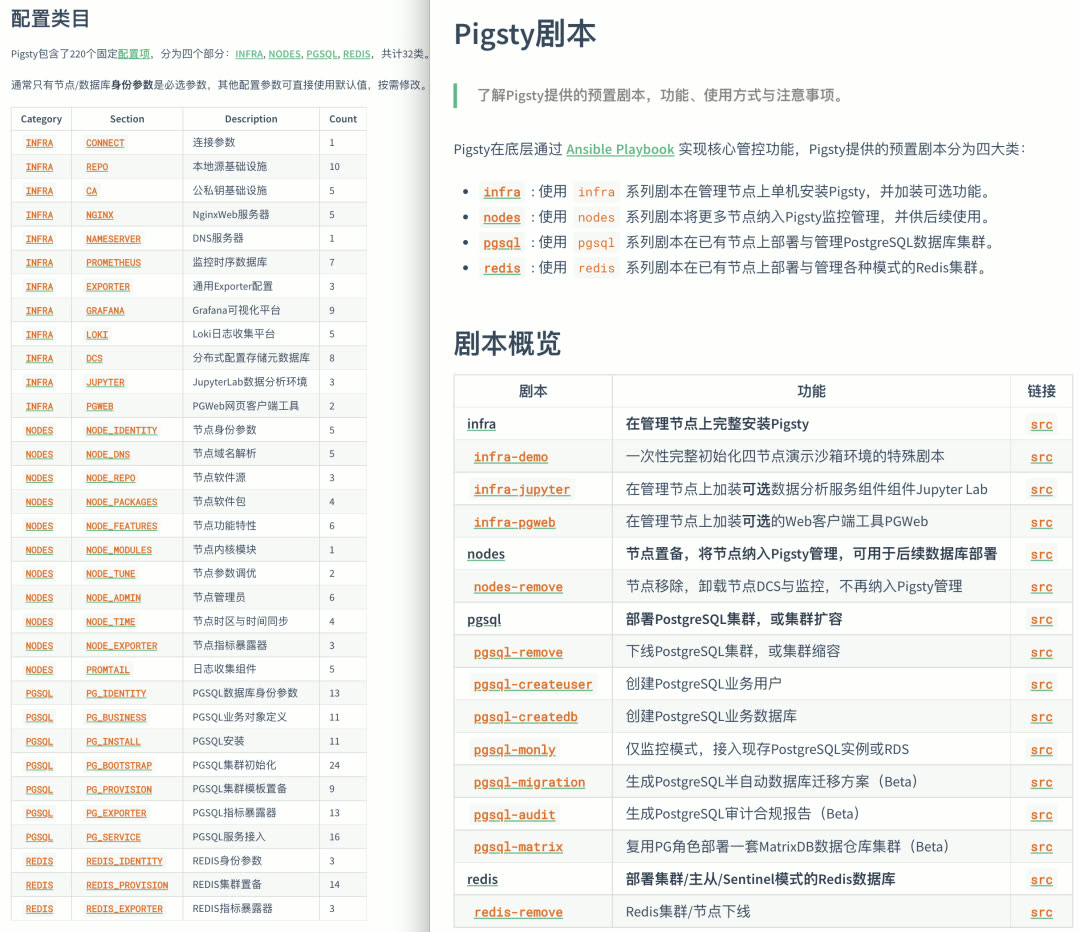
Modular playbooks and configuration parameters
New Database Support
PostgreSQL is a versatile database kernel, but as organizations and data grow, specialized data components become necessary. The two most typical are: caching (Redis) and data warehousing (Greenplum).
Redis further strengthens business system OLTP capabilities, offloads database pressure, and developers love its simple model. Greenplum significantly enhances OLAP capabilities, using the same language, drivers, and interfaces as PostgreSQL, scaling analytics from tens of TB to PB or even ZB scale.
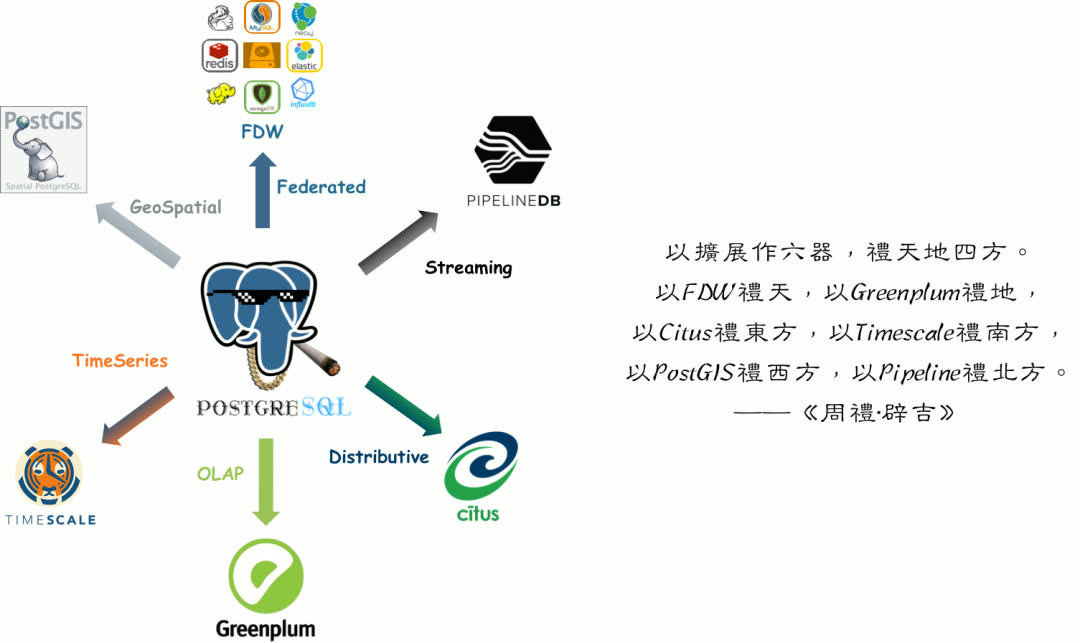
Redis and Greenplum extend PostgreSQL’s capability boundaries in two directions — both are common PostgreSQL companions, frequently used together. Therefore, Pigsty v1.4 provides preliminary support for Redis and Greenplum.
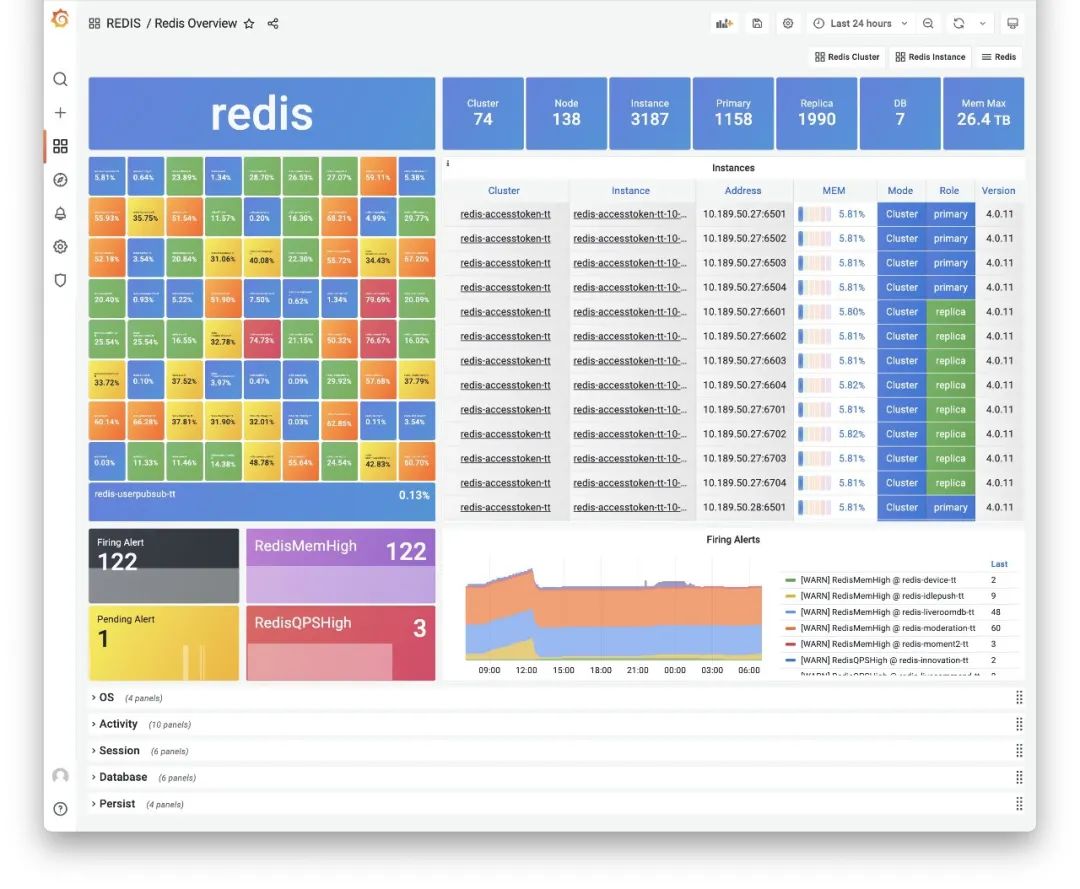
Redis Overview Dashboard
Note that Pigsty supports not native Greenplum, but a fork: MatrixDB. The official Greenplum version is still 6.x based on PostgreSQL 9.6 kernel. MatrixDB is based on Greenplum 7 and PostgreSQL 12 kernel, with additional time-series functionality. So Pigsty uses MatrixDB as the Greenplum implementation.
In Pigsty v1.4, there’s no dedicated MATRIXDB module — MatrixDB deployment completely reuses the PGSQL module. You can configure MatrixDB with familiar configuration parameters. From Pigsty’s perspective, a MatrixDB data warehouse is logically N pairs of standard primary-replica PGSQL clusters: one standard Master cluster (Master & Standby), and multiple Segment clusters (Primary & Mirror) distributed across nodes. All PGSQL dashboards work directly with MatrixDB.
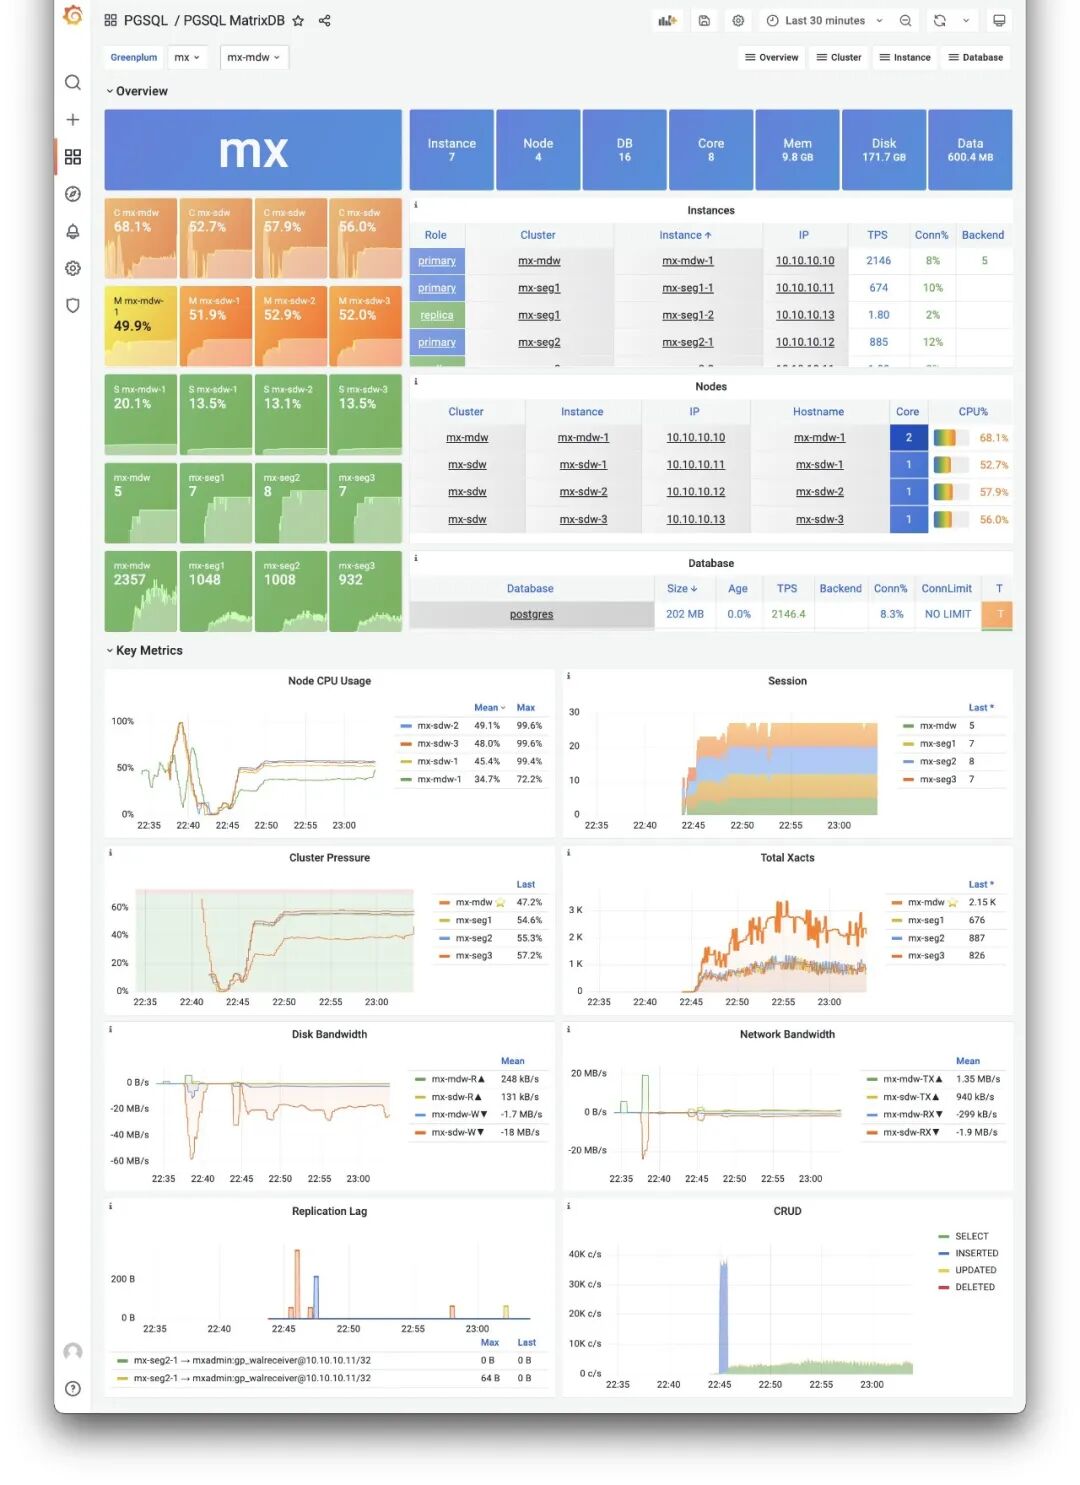
PGSQL MatrixDB Dashboard
The dedicated PGSQL Matrix dashboard shows core monitoring metrics for a MatrixDB deployment, while other monitoring dashboards reuse existing PGSQL panels.
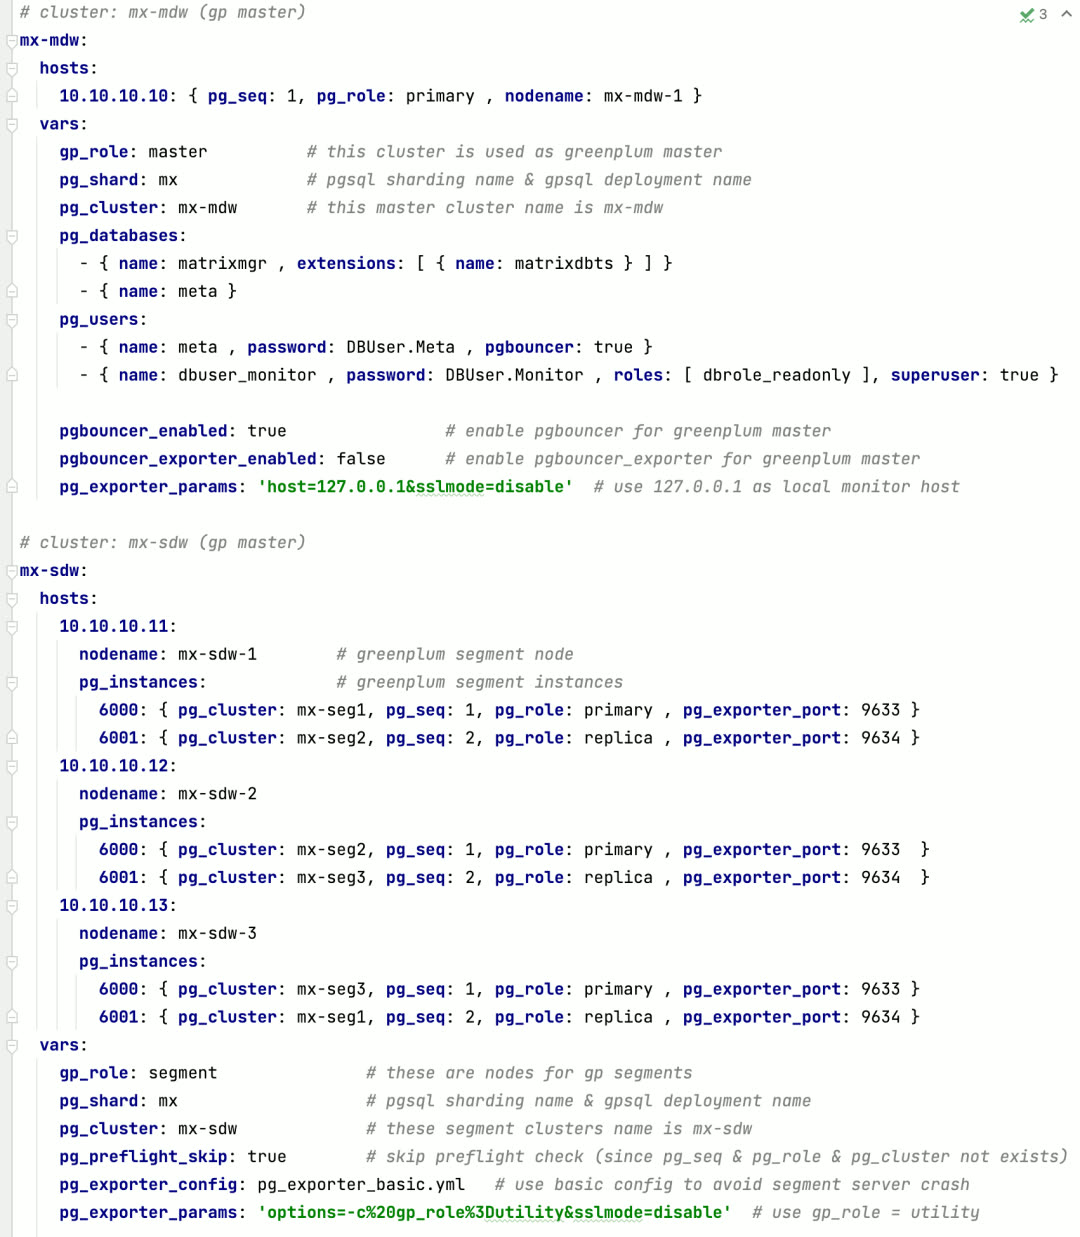
Defining a 4-node MatrixDB requires only this configuration
Monitoring System Evolution
The monitoring system has always played a core role in Pigsty. In v1.4, Pigsty’s monitoring system has significant improvements.
Host Monitoring
Pigsty v1.4 introduces brand new node monitoring capabilities — a direct result of the modular refactor. Previously, machine monitoring metrics were 1:1 bound to PostgreSQL instances. For a PostgreSQL distribution, this design was fine. But as Pigsty evolved, this design became outdated.
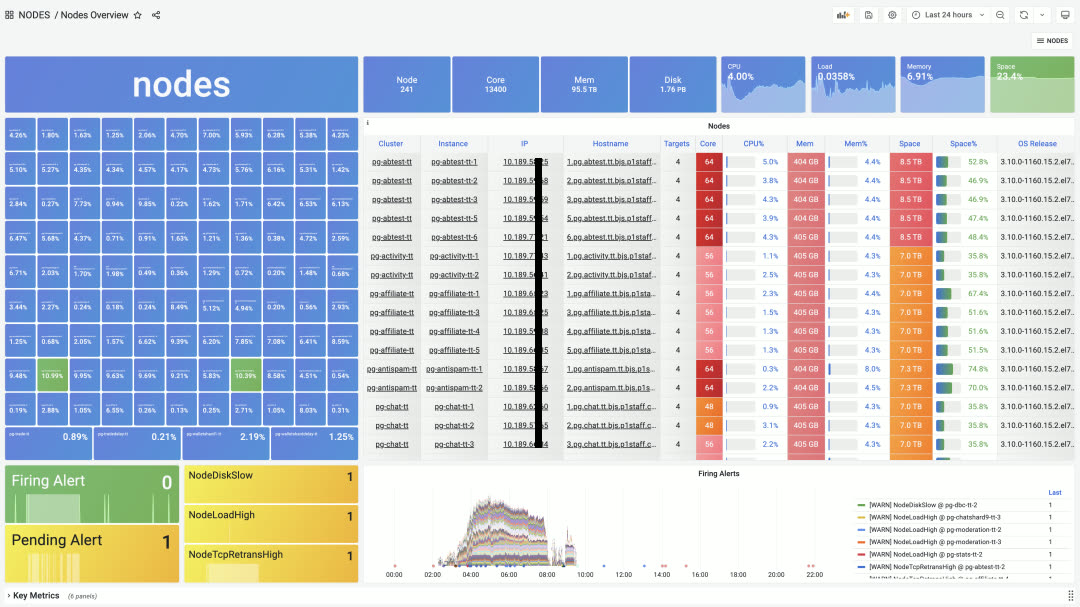
NODES Overview panel, providing navigation for all nodes
Users may have various deployment strategies, such as deploying multiple database instances on one node, or even multiple different database types. In such cases, the right approach is to separate node management and monitoring from specific database types.
This brings two significant benefits: first, if users only need node monitoring and management without database monitoring, it’s much simpler than before; second, a single node can deploy multiple or even different types of databases while reusing the same node monitoring data. Anytime you click an IP address, you jump to the specific NODES Instance to view node details.
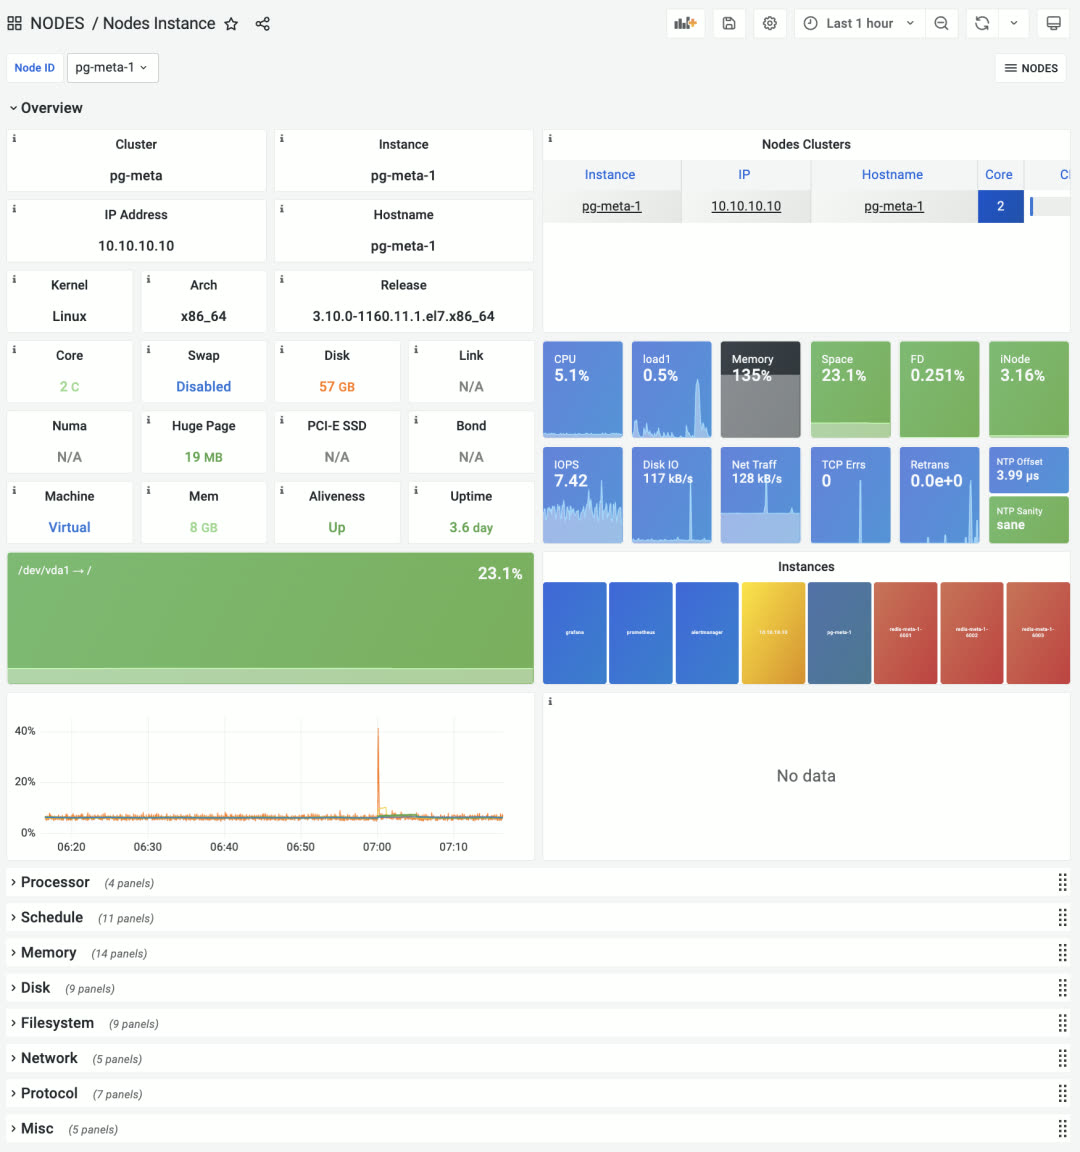
The former PGSQL Node is now NODES Instance
Node monitoring provides three levels: global overview, cluster, and single node. Node clusters can be configured to match PostgreSQL database clusters by default, or have independent identity configuration for viewing cluster resources from different perspectives.
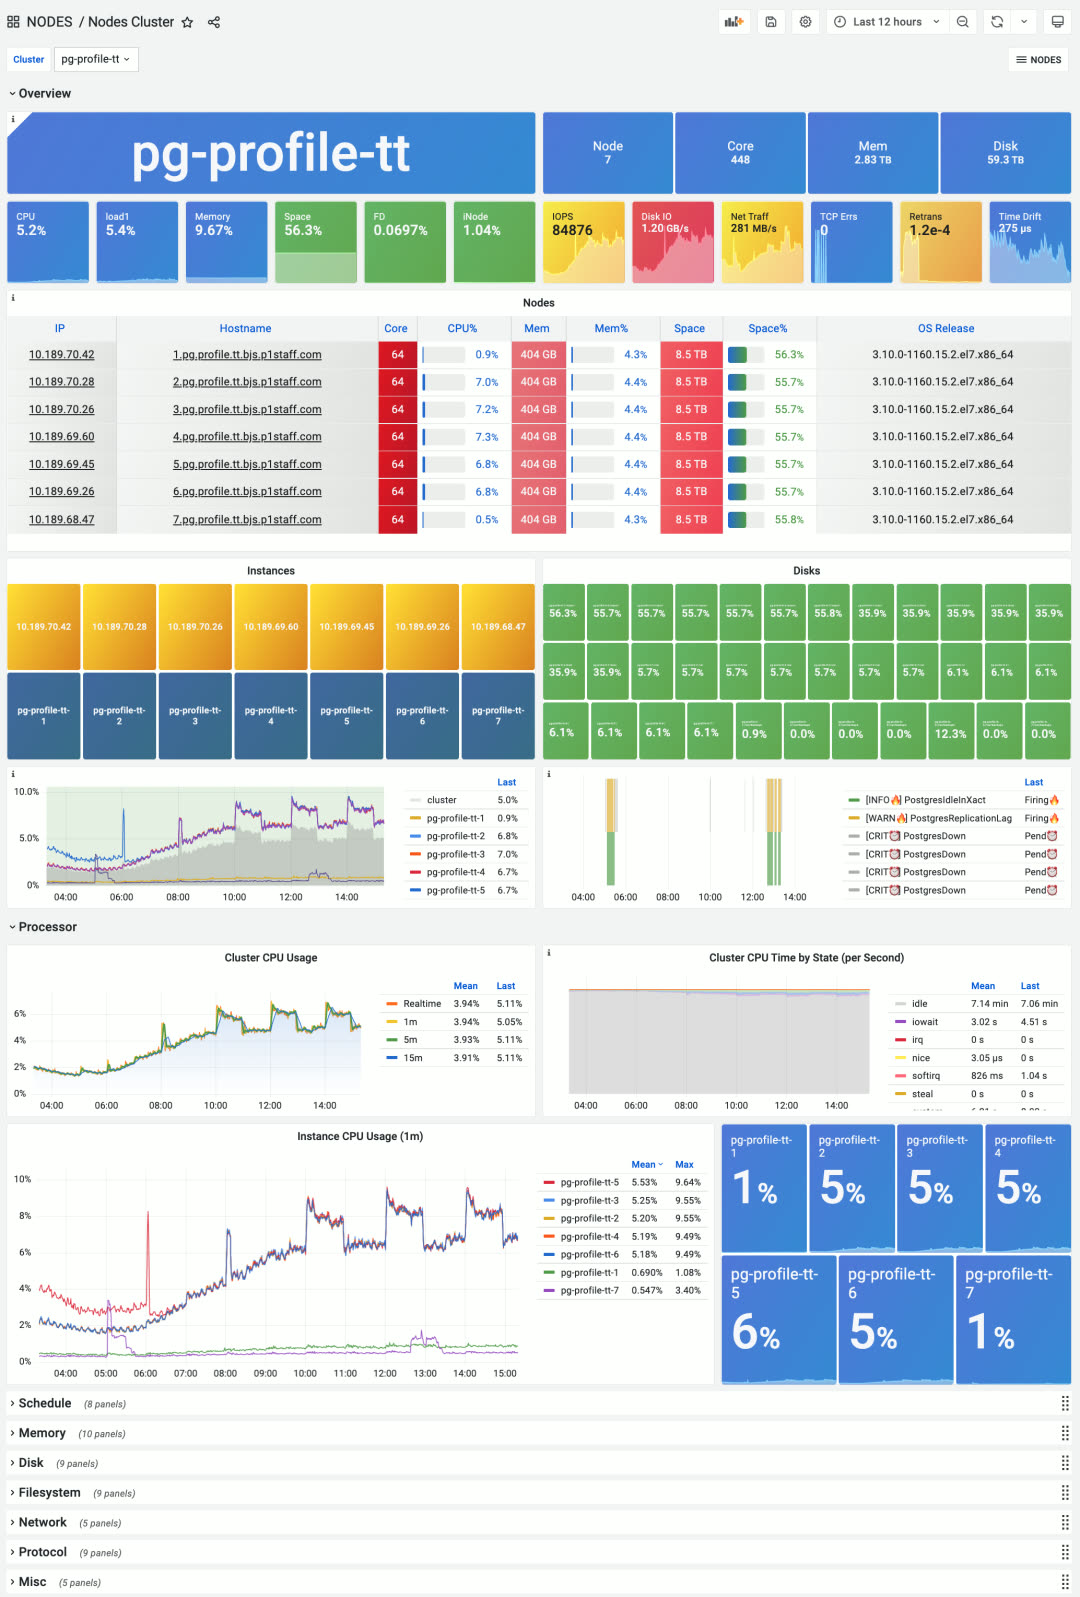
New Nodes Cluster panel, focusing on aggregate metrics and horizontal comparison within a node group
While Pigsty is positioned as a batteries-included PostgreSQL distribution, it also contains host monitoring best practices. Some users don’t need database features at all — they just use Pigsty for host monitoring.
Log Collection
In Pigsty v1.4, Loki and Promtail log collection components are upgraded to default system components. Loki, made by Grafana Labs, uses a label system similar to Prometheus with LogQL similar to PromQL. It’s a lightweight, elegant log collection, processing, and analysis solution.
After a year of testing and refinement, Loki is now a default part of Pigsty, collecting various logs in real-time: node syslog, dmesg, cron logs, database postgres/pgbouncer/patroni logs, and Redis logs.
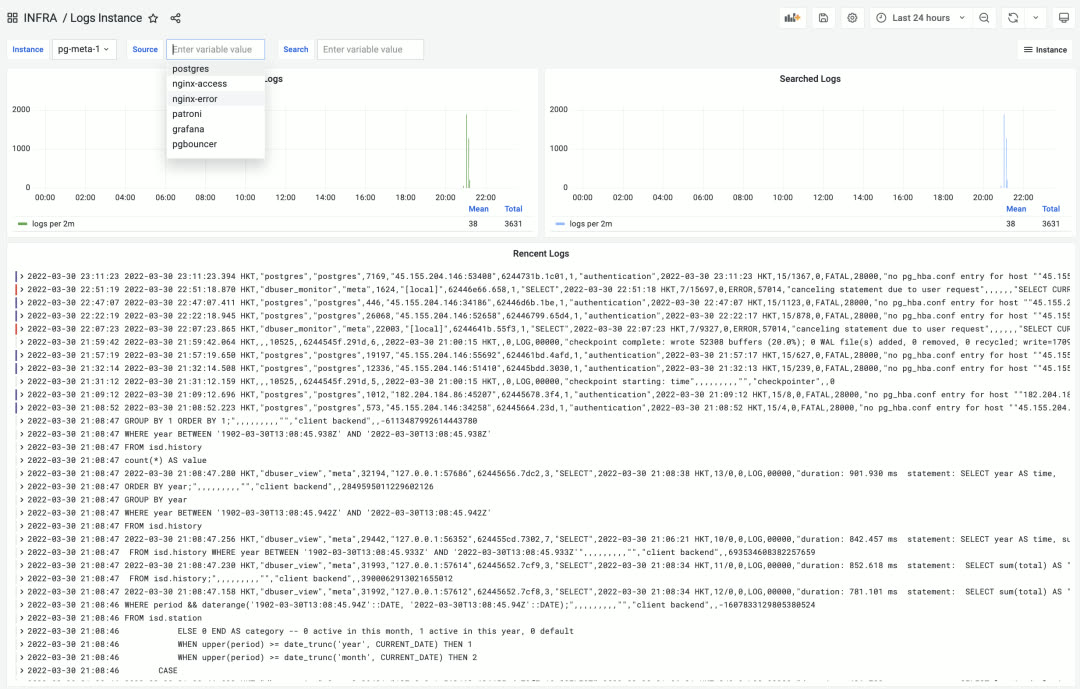
LOGS Instance monitoring panel in the INFRA section for real-time log browsing and searching
ELK is overkill for SRE logging needs — what people really want is an efficient, fast, massively parallel GREP. Loki excels at this.
Additionally, besides node logs, you can also view real-time infrastructure log data from the new INFRA Overview panel.
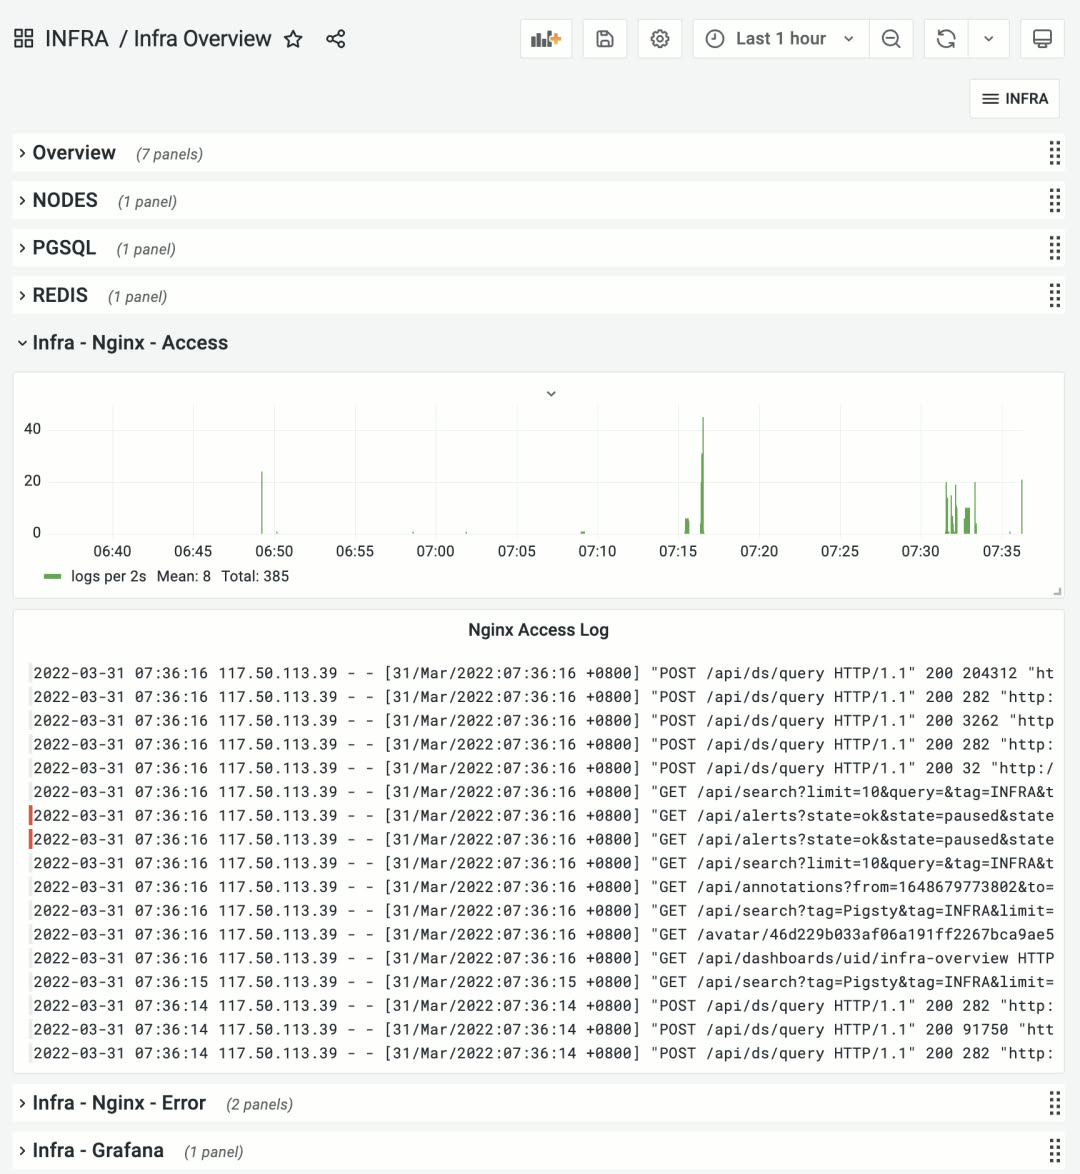
INFRA Overview panel showing infrastructure logs
PGSQL Monitoring
Pigsty v1.4 provides monitoring support for new database types, but classic PostgreSQL monitoring wasn’t neglected. In v1.4, many PGSQL monitoring panels were adjusted and remade. The most representative is the PGSQL Cluster panel.
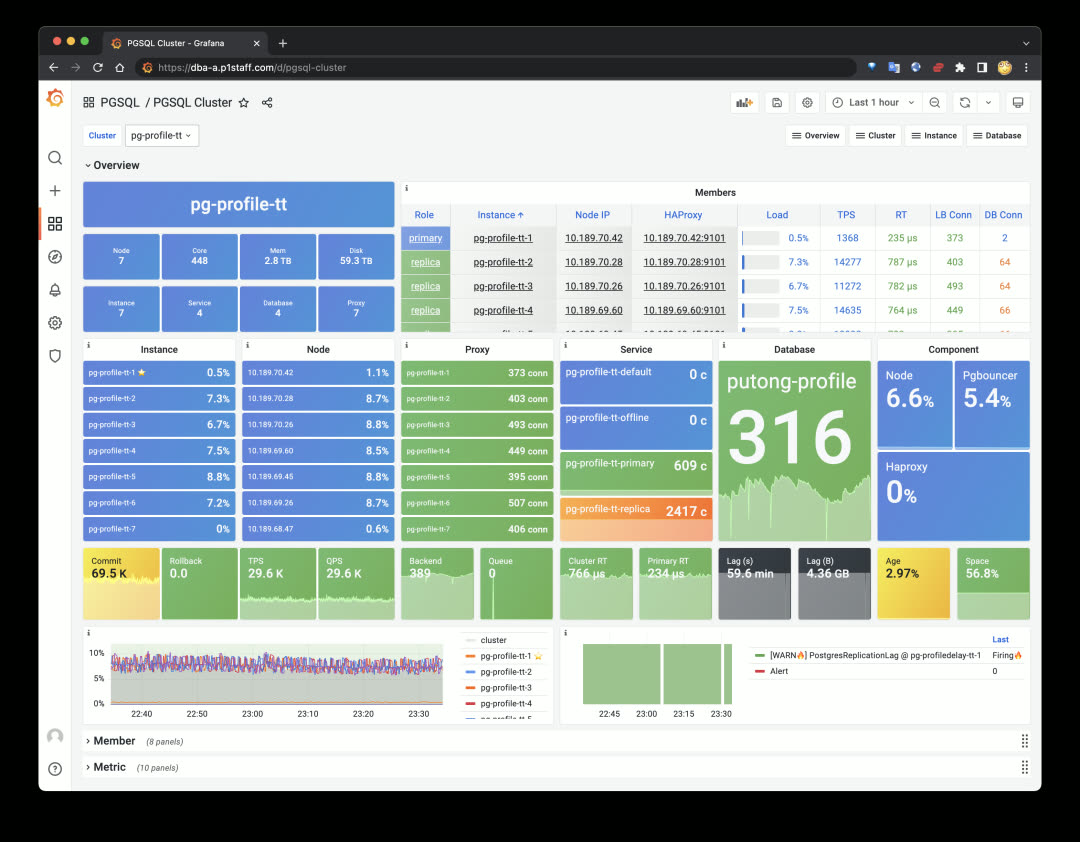
New PGSQL Cluster monitoring panel first screen
PGSQL Cluster is one of the most core monitoring panels in Pigsty database monitoring, serving as a connecting hub to display an autonomous database cluster’s key status. The new design hides unnecessary information and focuses on cluster resources. You can quickly click cluster resource objects from the first screen to navigate to detailed monitoring panels: including nodes, instances, load balancers, services, databases, and service components.
Beyond cluster resource objects, PGSQL Cluster’s first screen only shows the most critical monitoring metrics, alert events, and cluster/instance pressure levels. Other details are hidden in the topic sections below.
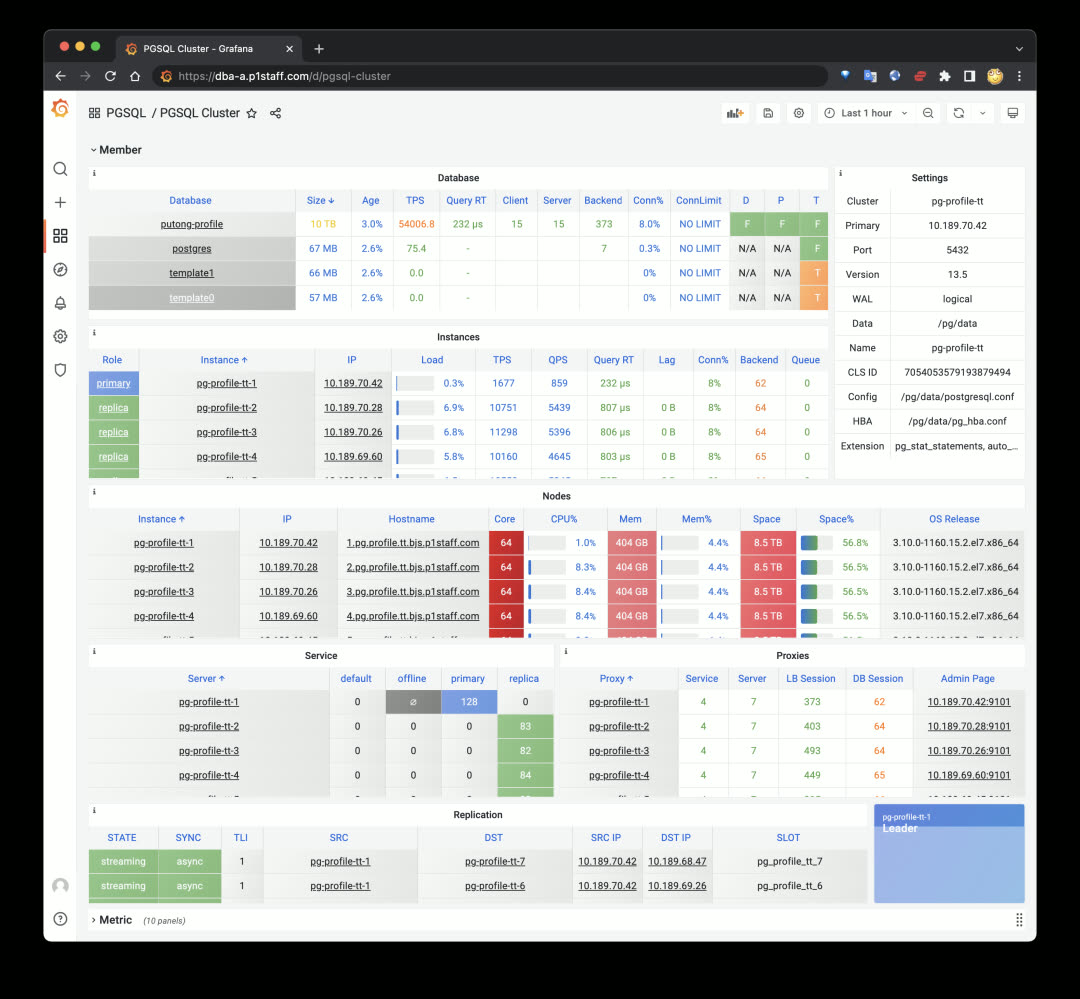
Member details table in the hidden second section by default
The second significant improvement is the new PGSQL Databases panel. Previously, database-internal monitoring only focused on single objects within single instances. But for business objects like tables and indexes, the focus is on their overall metrics across the entire cluster. PGSQL Databases was created for this. You can query a database’s performance across the entire cluster, horizontally comparing differences between instances:
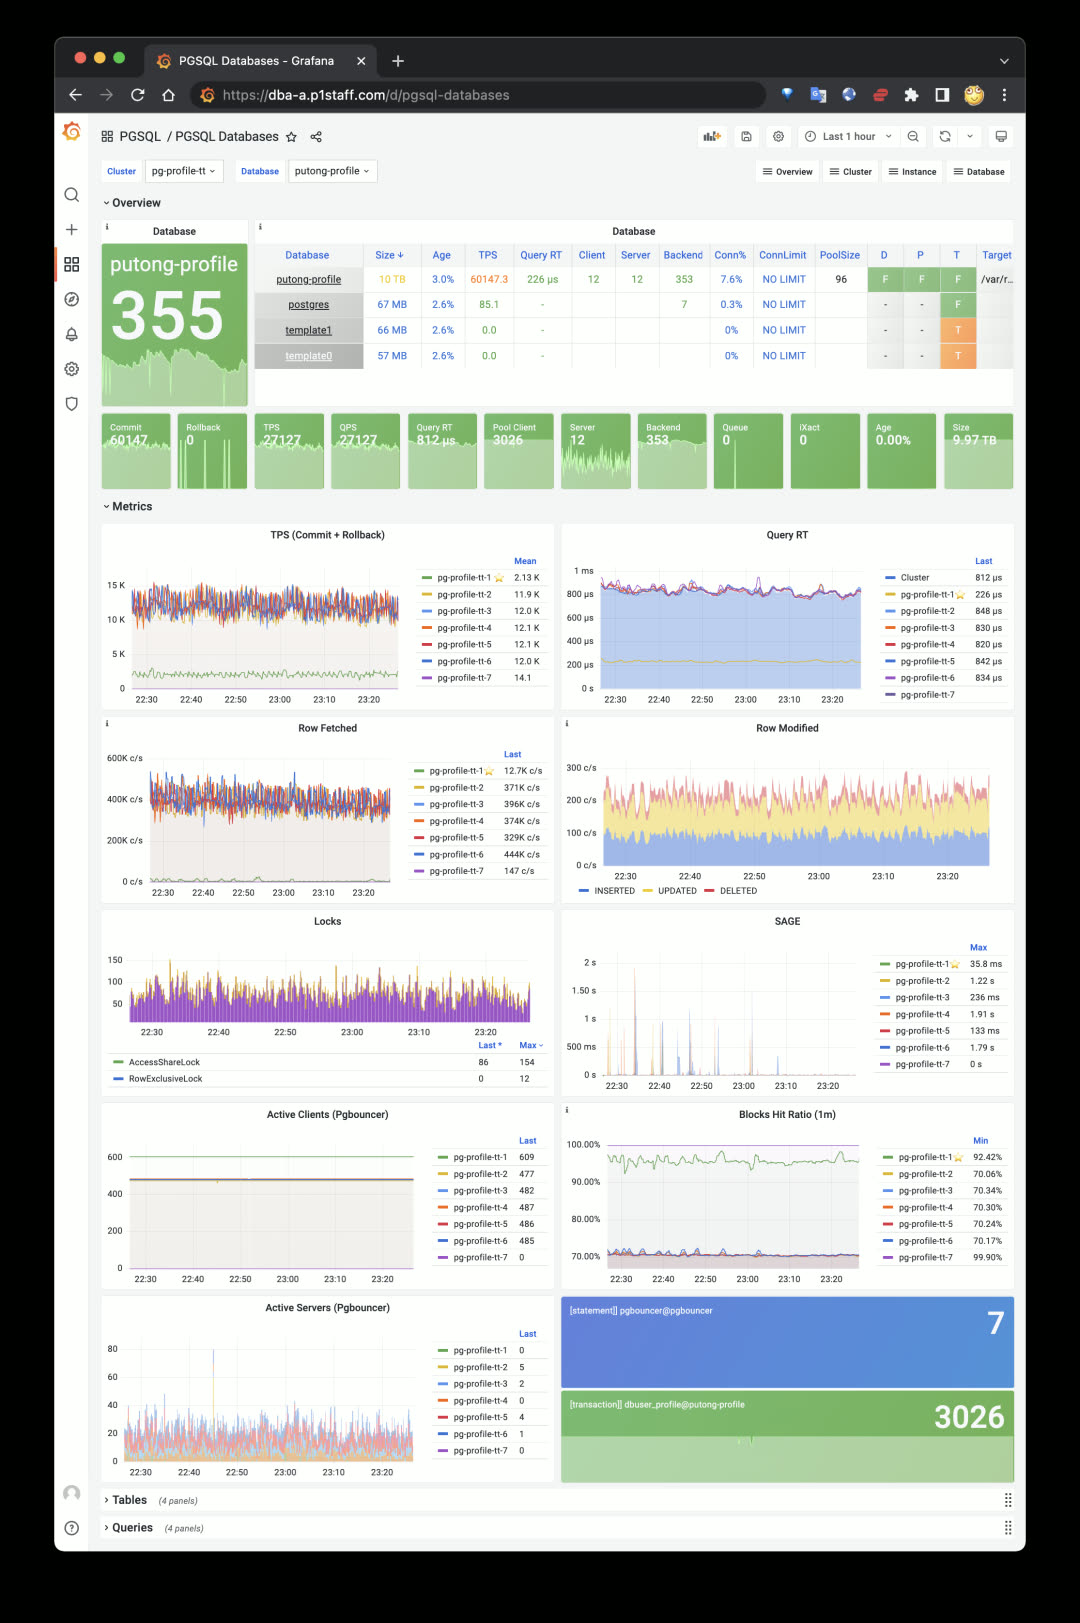
PGSQL Databases panel:
agg(metrics{datname=*}) by (ins)
More importantly, you can see aggregate views of every table and query type across the cluster scope. For example, check a table’s or query type’s QPS on the cluster’s primary and replica instances, or confirm an index’s usage across different cluster instances — enabling targeted business and application optimization.
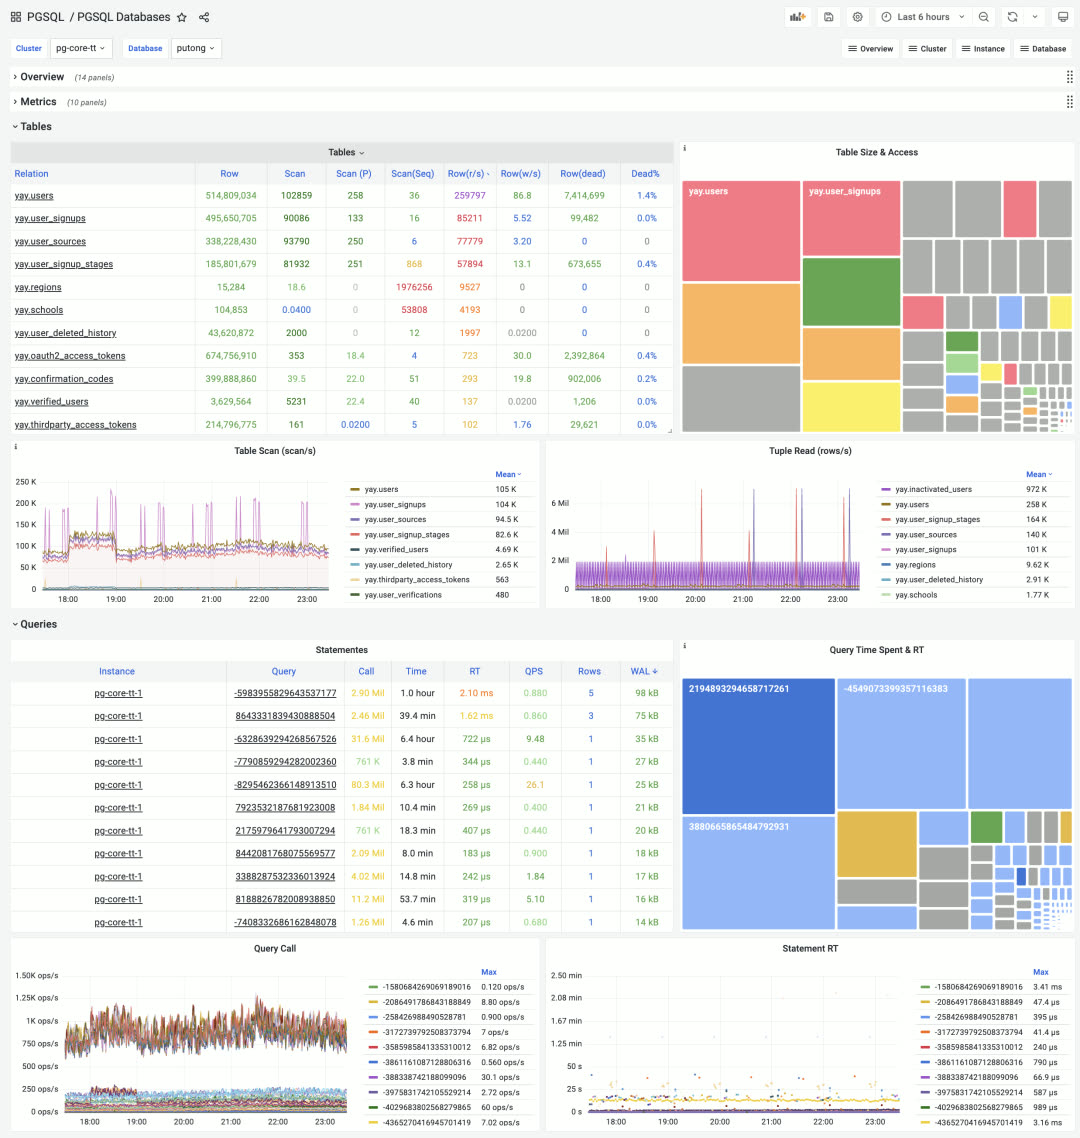
Cluster-level aggregate display of database objects: Tables & Queries, click to drill down
The colored TreeMap quickly reflects two-dimensional attributes: for tables, size represents space occupied, color represents access frequency. For queries, size represents total time spent on that query type, color represents average response time.
Application Dashboards
Besides the four core modules INFRA, NODES, PGSQL, REDIS, the Pigsty Grafana home has one more section: APP. This is for user applications. Any monitoring dashboard tagged with APP and Overview appears in Pigsty’s dashboard navigation. Pigsty ships with a ready-to-use small app PGLOG for analyzing PostgreSQL’s own CSV logs, quickly locating anomalies from logs and jumping to specific connection details.
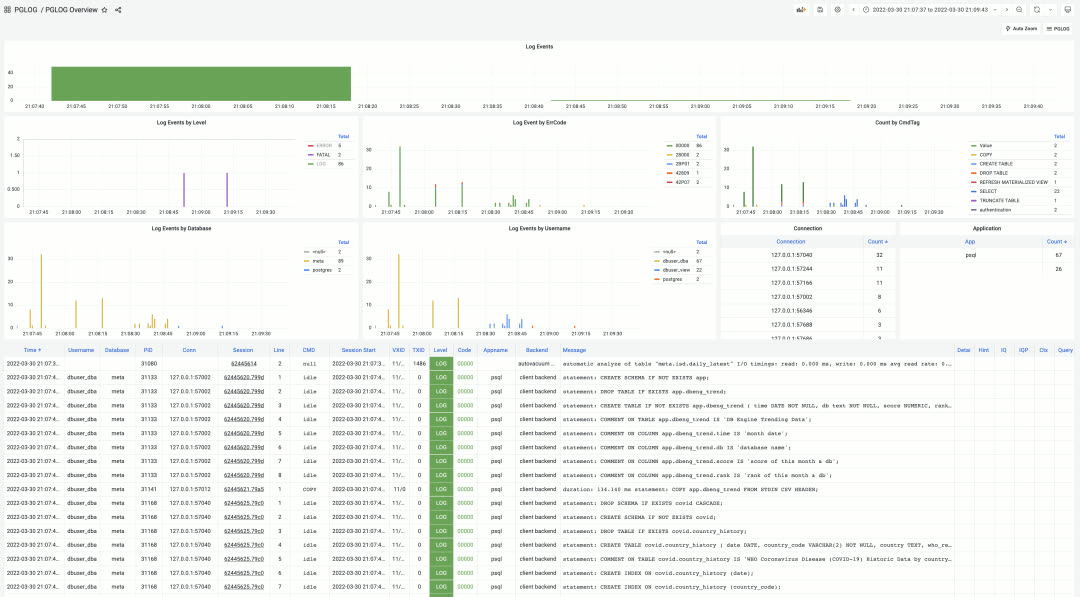
PGLOG Overview, using shortcuts to quickly load logs into application tables for analysis
Additionally, Pigsty established a dedicated code repository pigsty-app for hosting Pigsty sample applications. Current applications include:
| Application | Description |
|---|---|
| ISD | NOAA global surface weather station historical weather data query |
| COVID | WHO COVID-19 pandemic data query |
| DBENG | DB-Engine database popularity trends and predictions |
| APPLOG | Apple app privacy log visualization |
| WORKTIME | Work hours at major tech companies |
More data application examples will be added continuously.
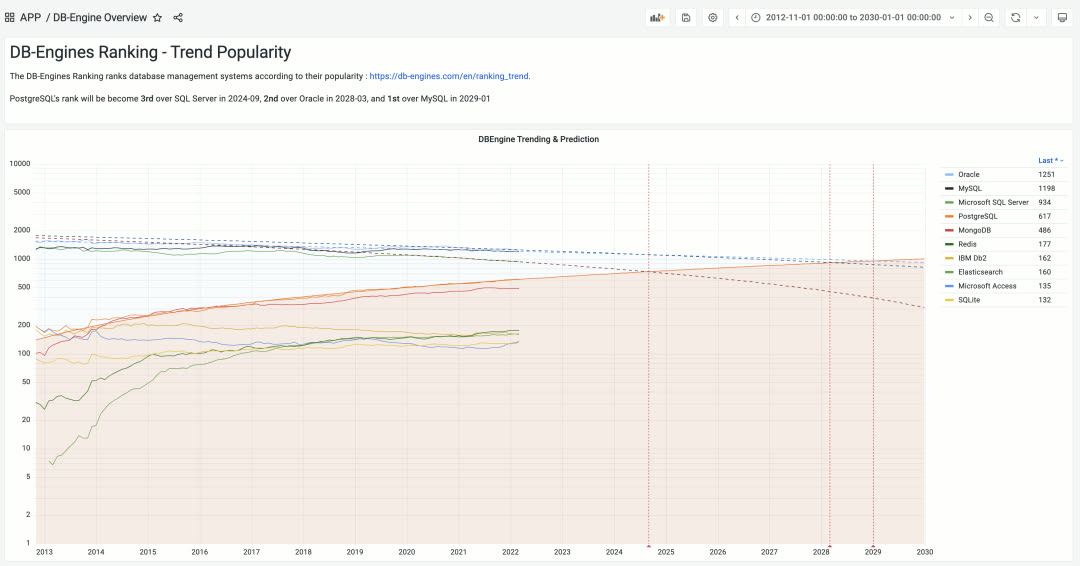
DBEng Trend: Using authoritative DB-Engines popularity data to predict when PostgreSQL will become the world’s most popular relational database
Installation Experience / CDN
Previously Pigsty used GitHub as the release platform, which was difficult to access from mainland China. So we enabled a global CDN domain http://download.pigsty.cc. For example, the latest source package and offline package download URLs are:
Pigsty’s software packages were reorganized and slimmed down from 1.3GB to 940MB in v1.4. Users needing Greenplum and MatrixDB can download a separate offline package matrix.tgz (338MB).
Pigsty v1.4 provides a dedicated download script download for automatically downloading and extracting optional packages pkg.tgz, matrix.tgz, app.tgz. This script auto-detects network environment, using GitHub Releases outside the GFW and Tencent Cloud CDN inside China.
The Pigsty installation process is now:
Case Study: Tantan
Tantan is Pigsty’s largest user case. In March 2022, Tantan decommissioned the last legacy PostgreSQL database pg.meta.tt, with all production databases migrated to Pigsty. One hundred clusters are all managed by Pigsty v1.3.1 (with v1.4 monitoring). Auto-failover is enabled for all clusters, marking the official completion of the two-year Database Ascension Project.
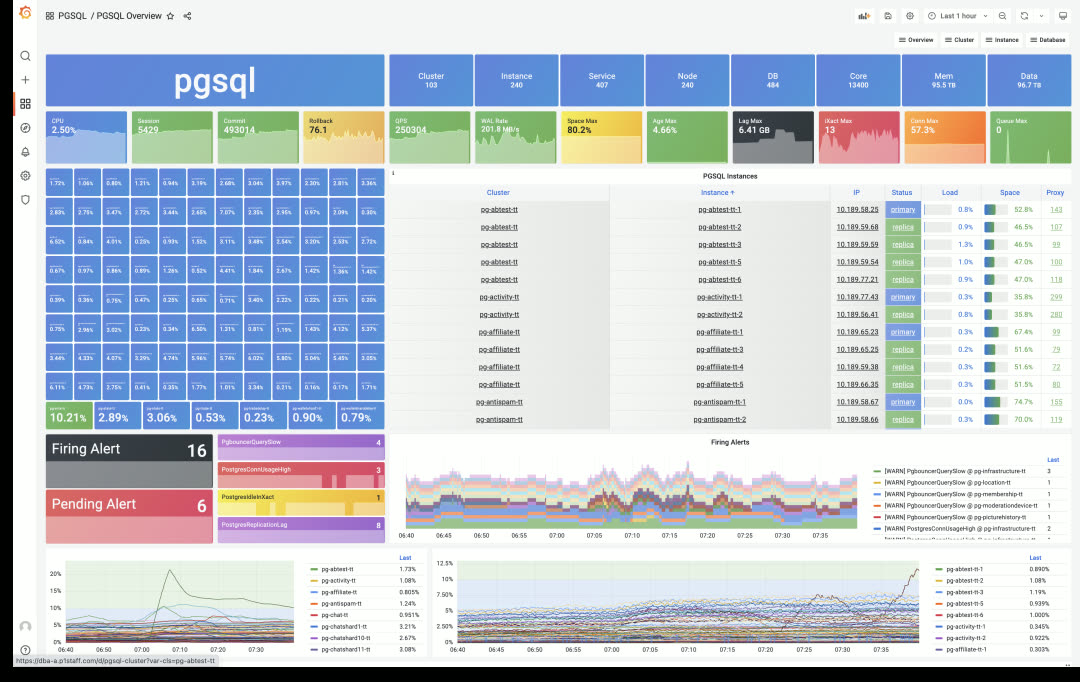
Tantan’s main production Pigsty deployment: 240 instances, 13,400 cores of PostgreSQL OLTP clusters
At Tantan, Pigsty underwent long-term, large-scale, rigorous production testing. Over two years of continuous refinement led to what it is today. In recent chaos engineering drills, ops randomly selected database machines for multiple crash tests. Pigsty automatically performed HA primary-replica/traffic failover with no human intervention. Replica crashes had no business impact; primary crashes affected business writes for less than 1 minute.
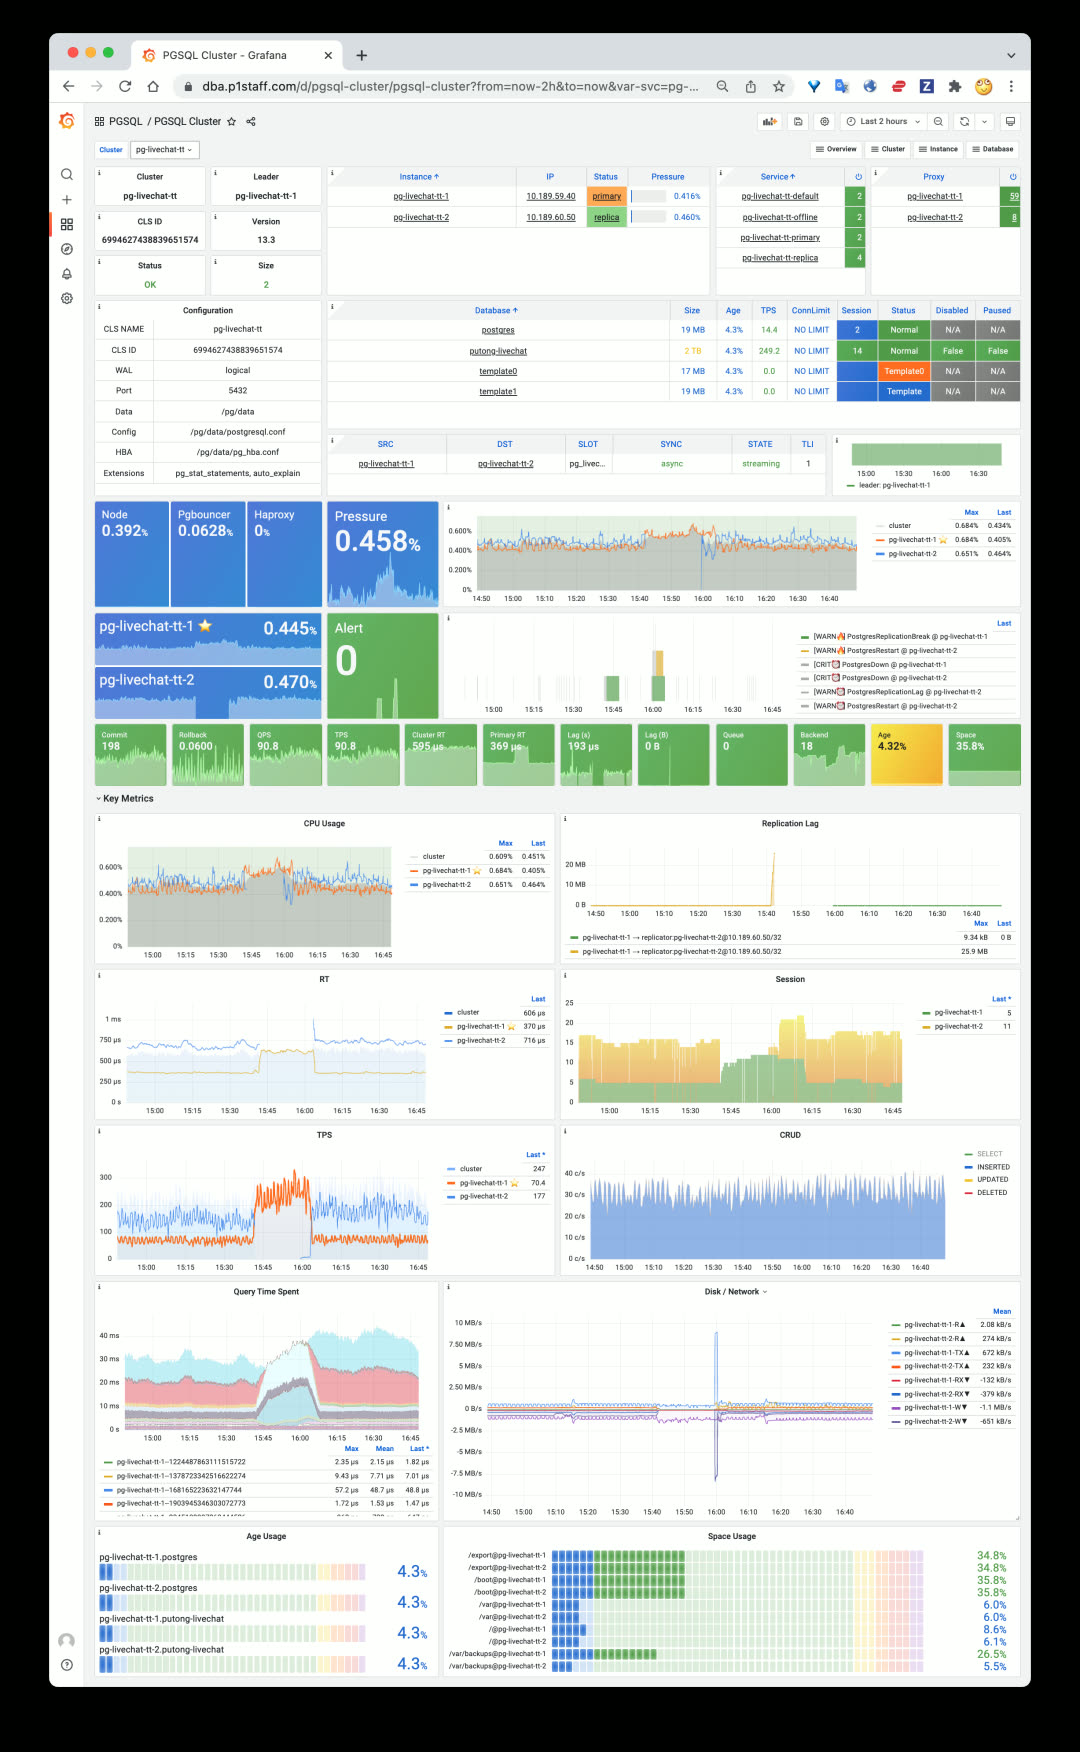
A typical replica crash scenario: read traffic quickly handled by primary, only a few in-flight queries interrupted, then immediate recovery
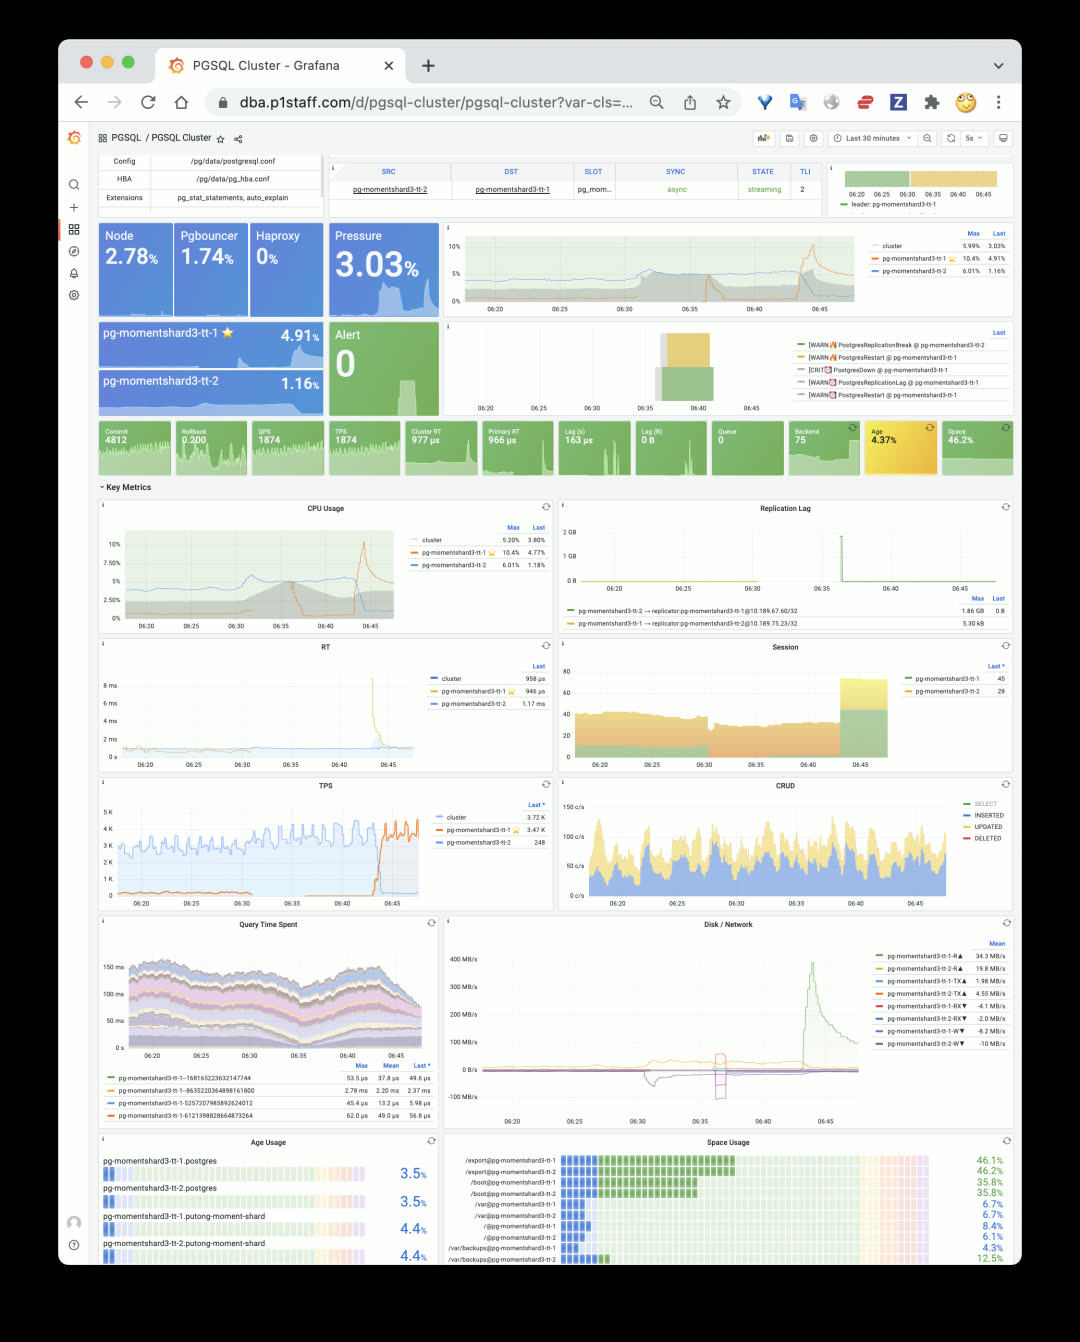
A typical primary crash scenario: 30s after primary goes down, replica is promoted to new primary, 30s of business write impact then self-healing
v1.4.0 Release Notes
Architecture
- Decoupled system into 4 major categories:
INFRA,NODES,PGSQL,REDIS, making Pigsty clearer and more extensible - Single-node deployment =
INFRA+NODES+PGSQL - PGSQL cluster deployment =
NODES+PGSQL - Redis cluster deployment =
NODES+REDIS - Other database deployment =
NODES+ xxx (e.g.,MONGO,KAFKA…)
Accessibility
- CDN for mainland China
- Use
bash -c "$(curl -fsSL http://get.pigsty.cc/latest)"to get latest source - New
downloadscript to download and extract packages
Monitoring Enhancements
- Split monitoring into 5 categories:
INFRA,NODES,REDIS,PGSQL,APP - Logging enabled by default
lokiandpromtailnow enabled by default, with prebuilt loki-rpm
- Model and labels
- Added hidden
dsprometheus datasource variable to all dashboards - Added
iplabel to all metrics, used as join key between database and node metrics
- Added hidden
- INFRA Monitoring
- INFRA main dashboard: INFRA Overview
- Added Log dashboard: Logs Instance
- PGLOG Analysis and PGLOG Session now treated as sample Pigsty APPs
- NODES Monitoring Application
- Pigsty can be used standalone as host monitoring software
- Includes 4 core dashboards: Nodes Overview & Nodes Cluster & Nodes Instance & Nodes Alert
- New identity variables for nodes:
node_clusterandnodename
- PGSQL Monitoring Enhancements
- New PGSQL Cluster, simplified and focused on what matters in a cluster
- New dashboard PGSQL Databases for cluster-level object monitoring
- PGSQL Alert dashboard now focuses solely on PGSQL alerts
- PGSQL Shard added to PGSQL
- Redis Monitoring Enhancements
- Added node monitoring to all Redis dashboards
MatrixDB Support
- MatrixDB (Greenplum 7) can be deployed via
pigsty-matrix.ymlplaybook - MatrixDB monitoring dashboard: PGSQL MatrixDB
- Added sample configuration:
pigsty-mxdb.yml
Software Upgrades
- PostgreSQL 14.2
- PostGIS 3.2
- TimescaleDB 2.6
- Patroni 2.1.3 (Prometheus metrics + failover slots)
- HAProxy 2.5.5 (fixed stats errors, more metrics)
- PG Exporter 0.4.1 (timeout parameters, etc.)
- Grafana 8.4.4
- Prometheus 2.33.4
- Greenplum 6.19.4 / MatrixDB 4.4.0
- Loki now provided as RPM package instead of ZIP archive
Bug Fixes
- Removed Patroni’s Consul dependency, making migration to new Consul clusters easier
- Fixed Prometheus bin/new script default data directory path
- Added restart seconds in vip-manager systemd service
- Fixed typos and tasks
API Changes
New Variables
node_cluster: Identity variable for node clusternodename_overwrite: If set, nodename will be set to node’s hostnamenodename_exchange: Exchange node hostnames between play hosts (in/etc/hosts)node_dns_hosts_extra: Extra static DNS records easily overridable by single instance/clusterpatroni_enabled: If disabled, postgres & patroni bootstrap not executed duringpostgresrolepgbouncer_enabled: If disabled, pgbouncer not started duringpostgresrolepg_exporter_params: Extra URL parameters for pg_exporter when generating monitoring target URLpg_provision: Boolean variable indicating whether to execute provisioning part ofpostgresroleno_cmdb: Used forinfra.ymlandinfra-demo.ymlplaybooks, won’t create CMDB on meta node
v1.4.1 Release Notes
Bug fixes / Docker support / English documentation
Docker is now enabled by default on the meta node, allowing you to spin up various software.
Bug Fixes
- Fixed Promtail & Loki configuration variable issues
- Fixed Grafana legacy alerts
- Disabled nameserver by default
- Renamed pg-alias.sh for Patroni shortcuts
- Disabled exemplars queries for all dashboards
- Fixed Loki data directory issue
- Changed
autovacuum_freeze_max_agefrom 100000000 to 1000000000
2.3 - Pigsty v1.3: Redis Support, PGCAT Overhaul, PGSQL Enhancements
Originally published on VONNG.

Pigsty v1.3 is officially released, featuring Redis support, a rebuilt PGCAT application, and enhanced PGSQL monitoring.
Redis Support
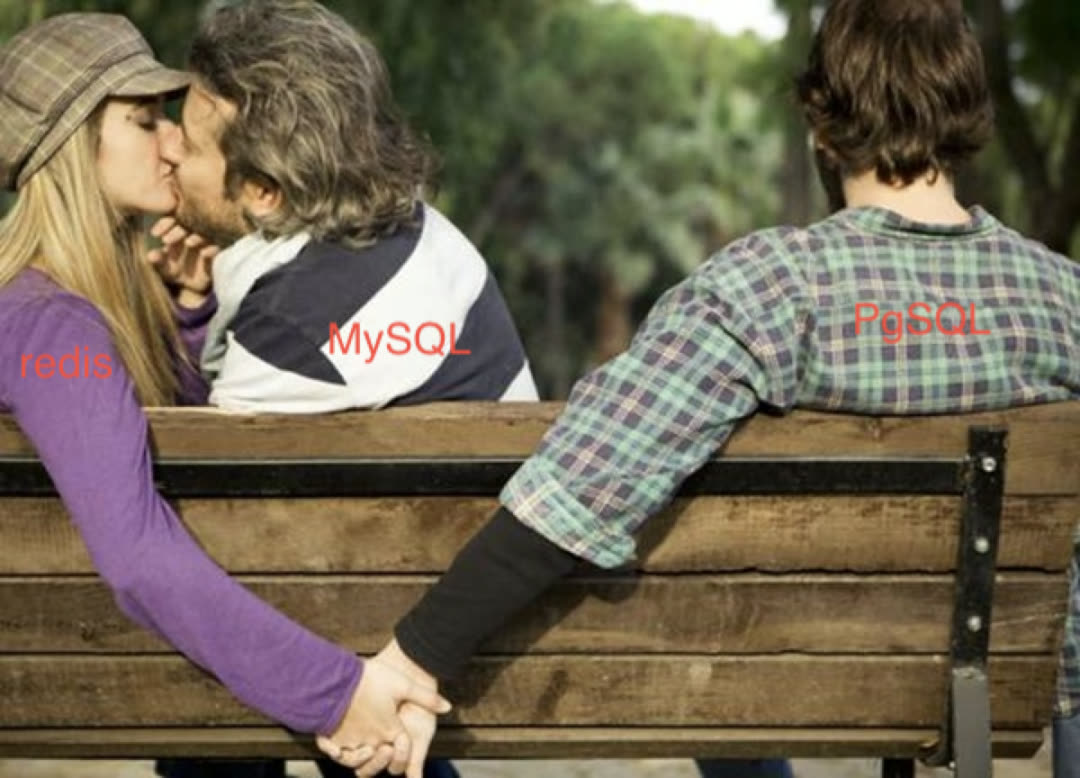
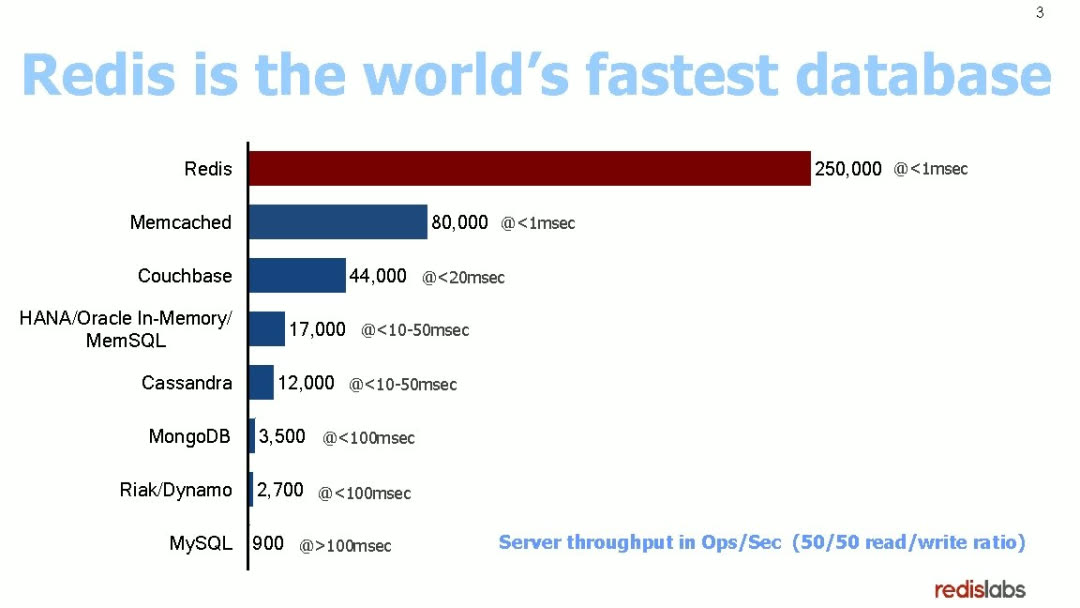
While PostgreSQL is the world’s most advanced open-source relational database, every hero needs a sidekick. Pigsty v1.3 introduces a powerful caching companion for PostgreSQL: the world’s fastest database — Redis.
Redis delivers incredible performance, easily hitting 200-300k QPS on a single core.
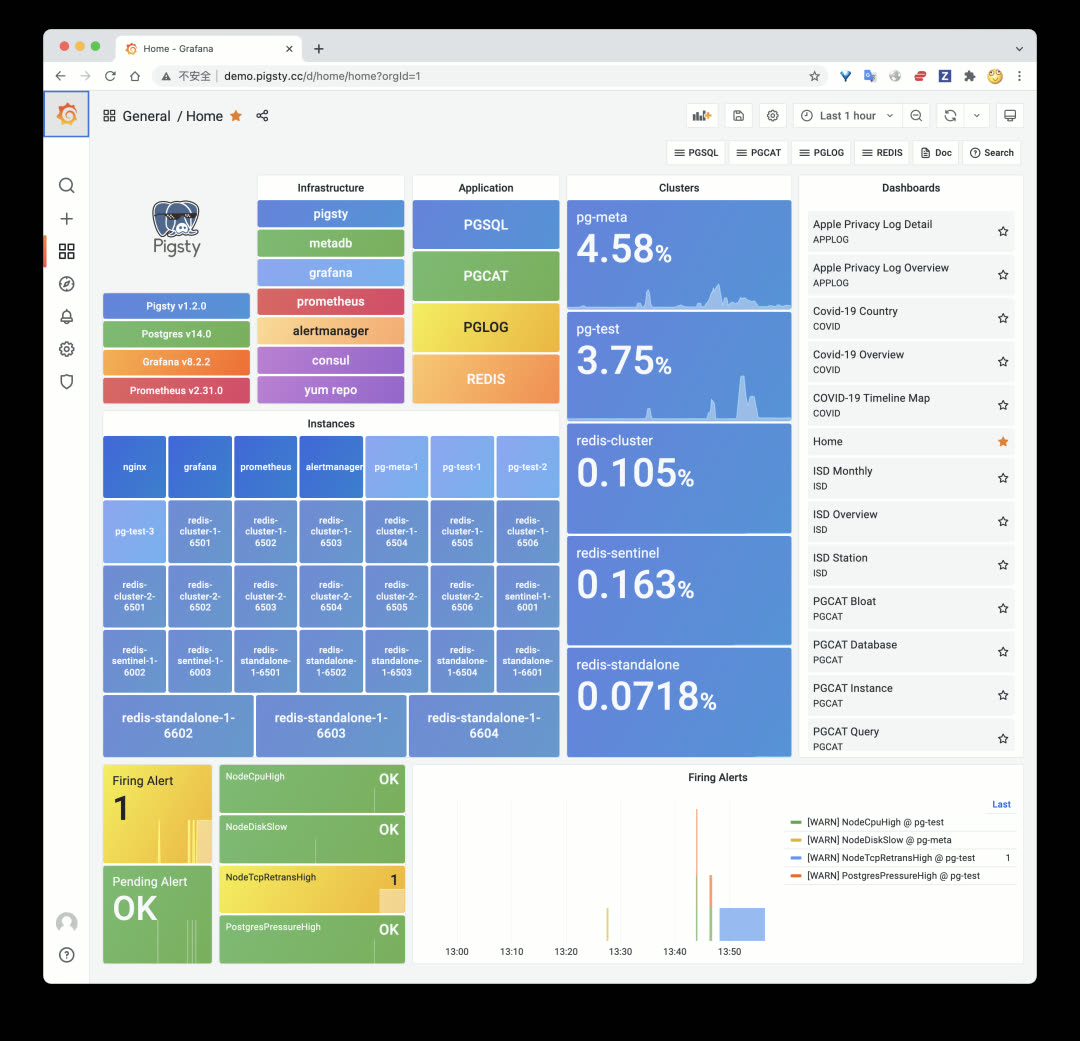
The Pigsty demo now includes Redis cluster examples:
Three Deployment Modes
Redis has three classic deployment patterns: primary-replica (Standalone), native cluster (Cluster), and high-availability sentinel (Sentinel). Pigsty v1.3 supports all three.
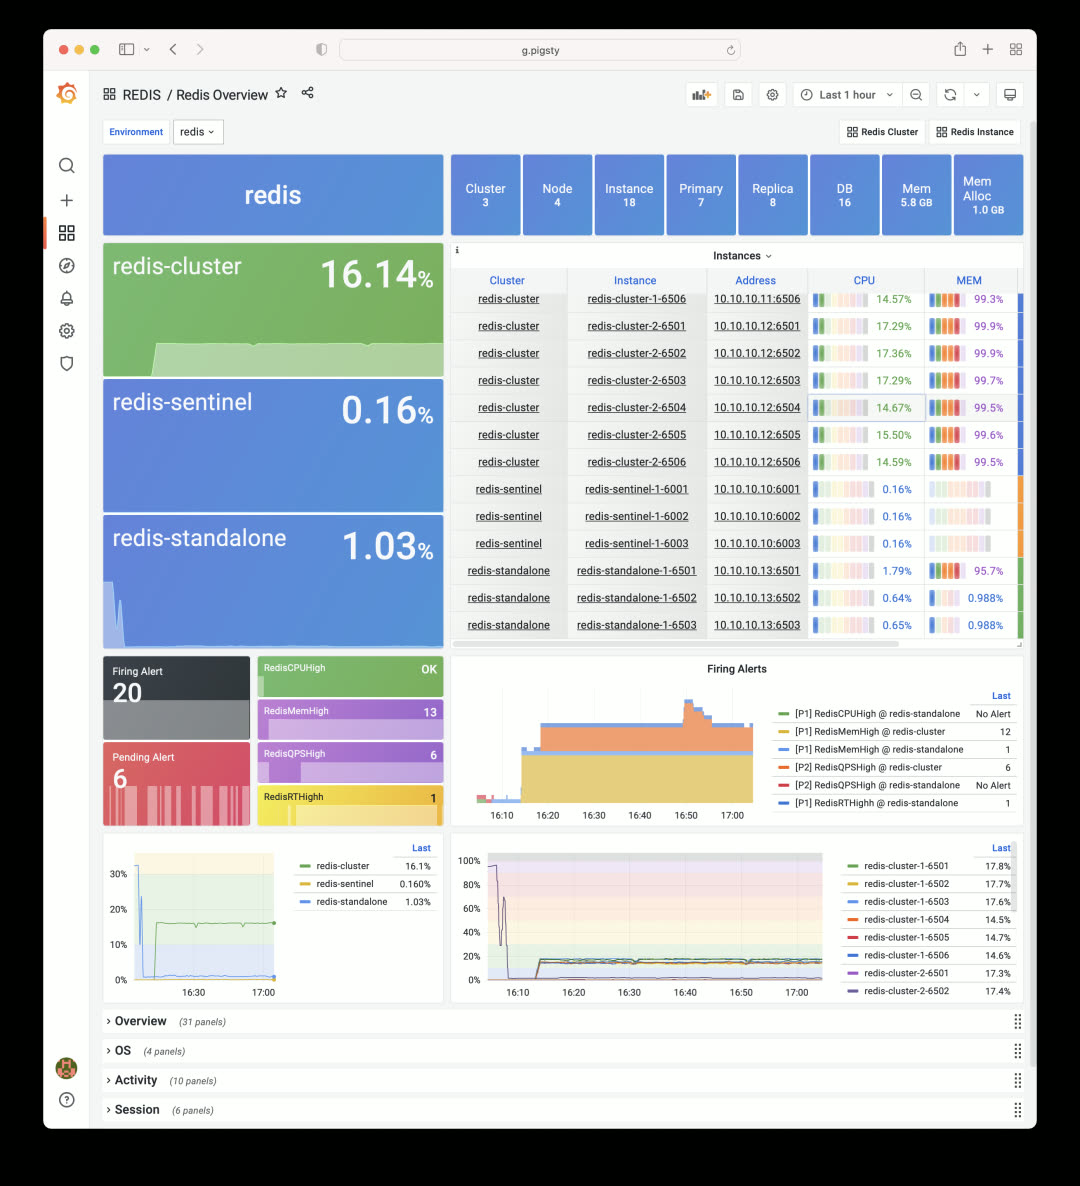
The Redis Overview dashboard shows three sample clusters, each demonstrating a different deployment mode.
Declarative Configuration
Defining a Redis cluster works the same way as PostgreSQL. After declaring your config, just run redis.yml -l <cluster> to create the cluster:
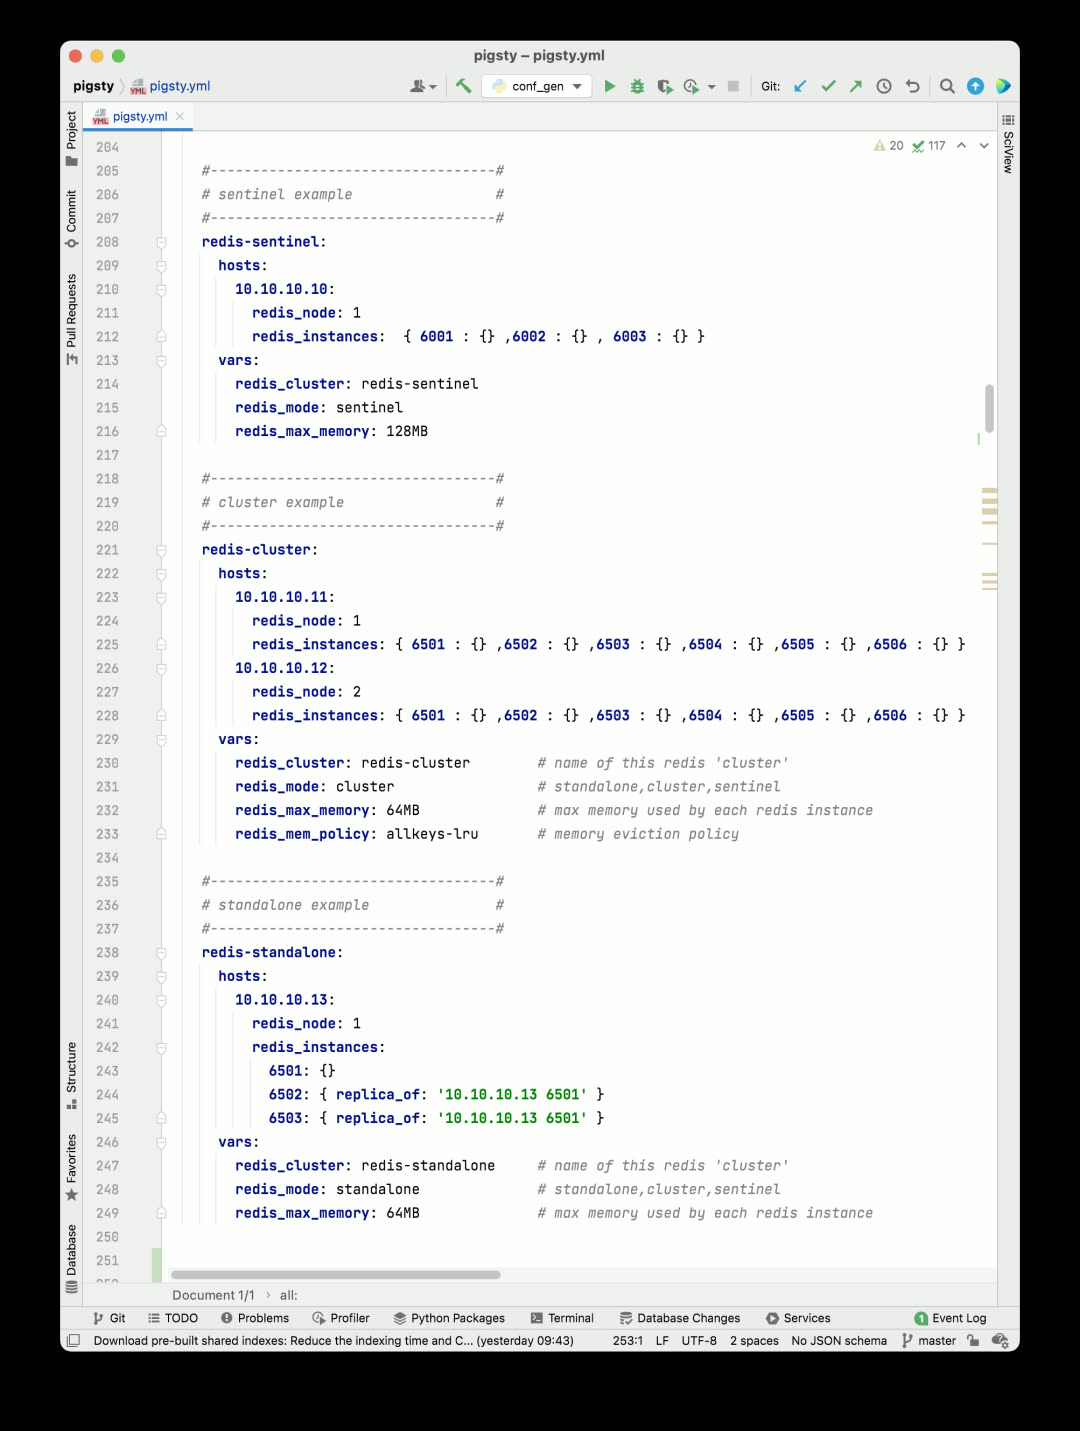
A Redis cluster only needs a few required identity parameters. Of course, you can use additional parameters for fine-grained configuration:
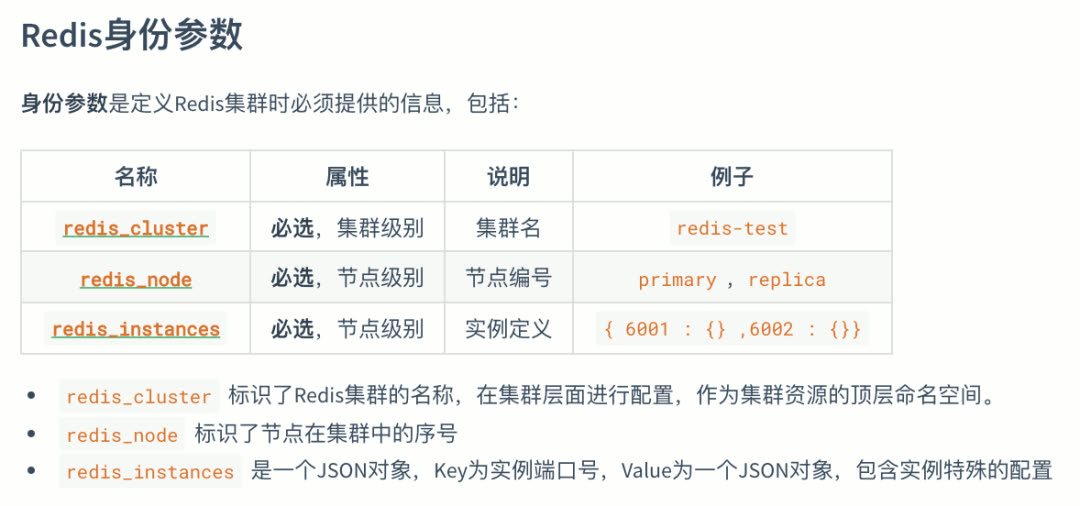
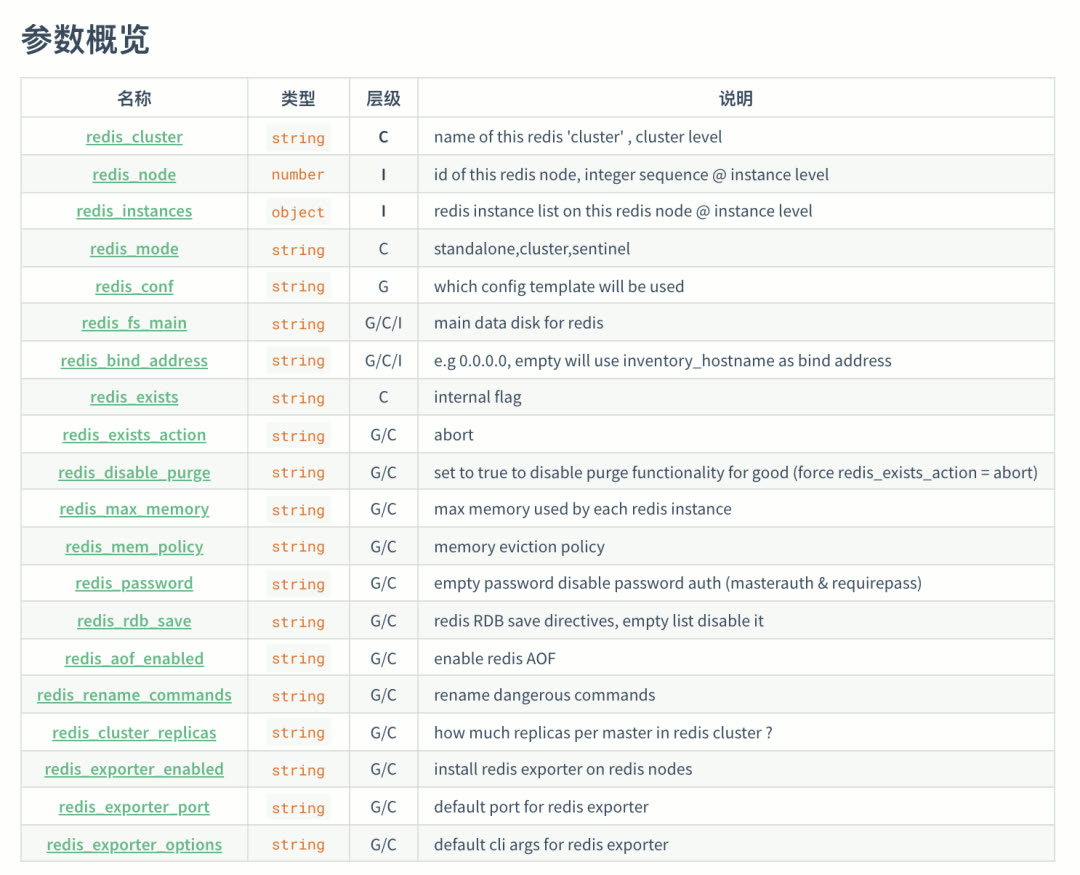
Auto-Monitoring
Redis clusters and instances created with Pigsty are automatically integrated into the monitoring system.
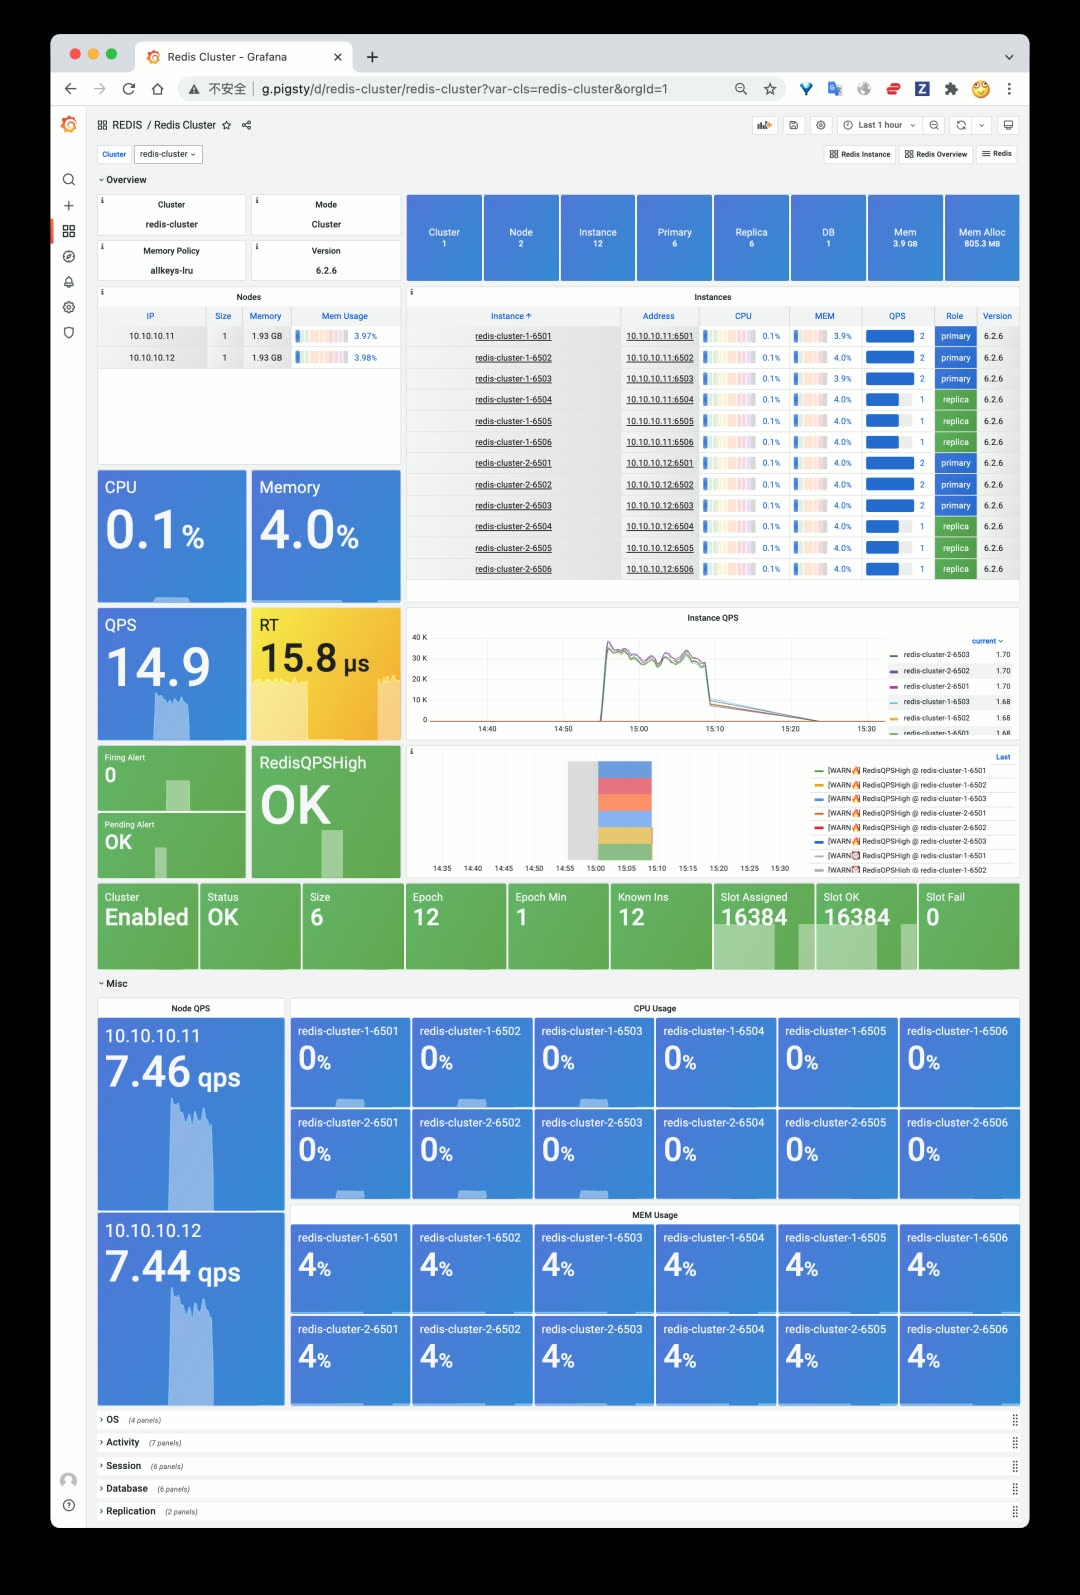
The Redis cluster dashboard homepage — click on a specific instance to jump to instance-level monitoring:
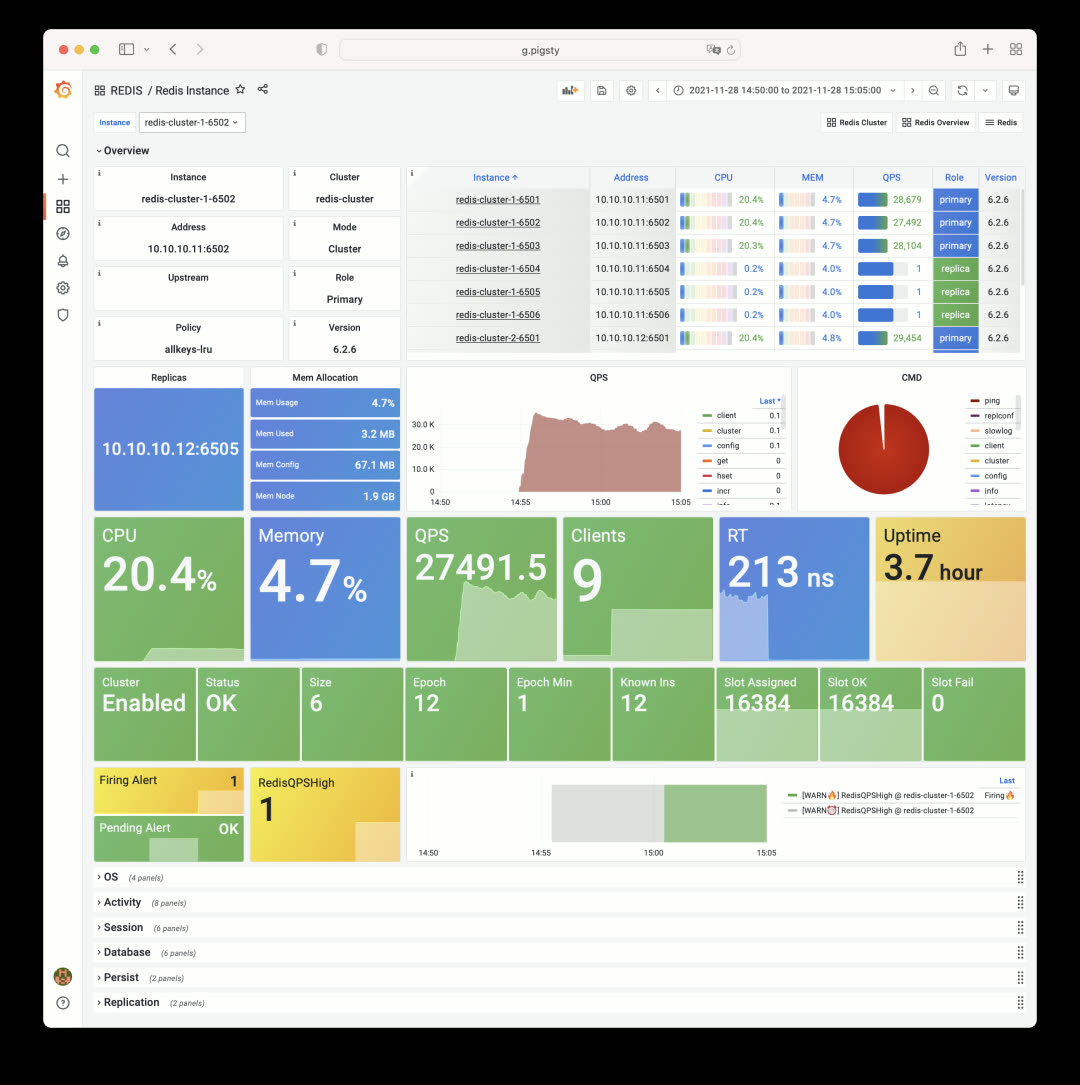
PGCAT Overhaul
v1.3 rebuilds the PGCAT application — a tool for browsing and visualizing PostgreSQL system catalogs directly from Grafana.
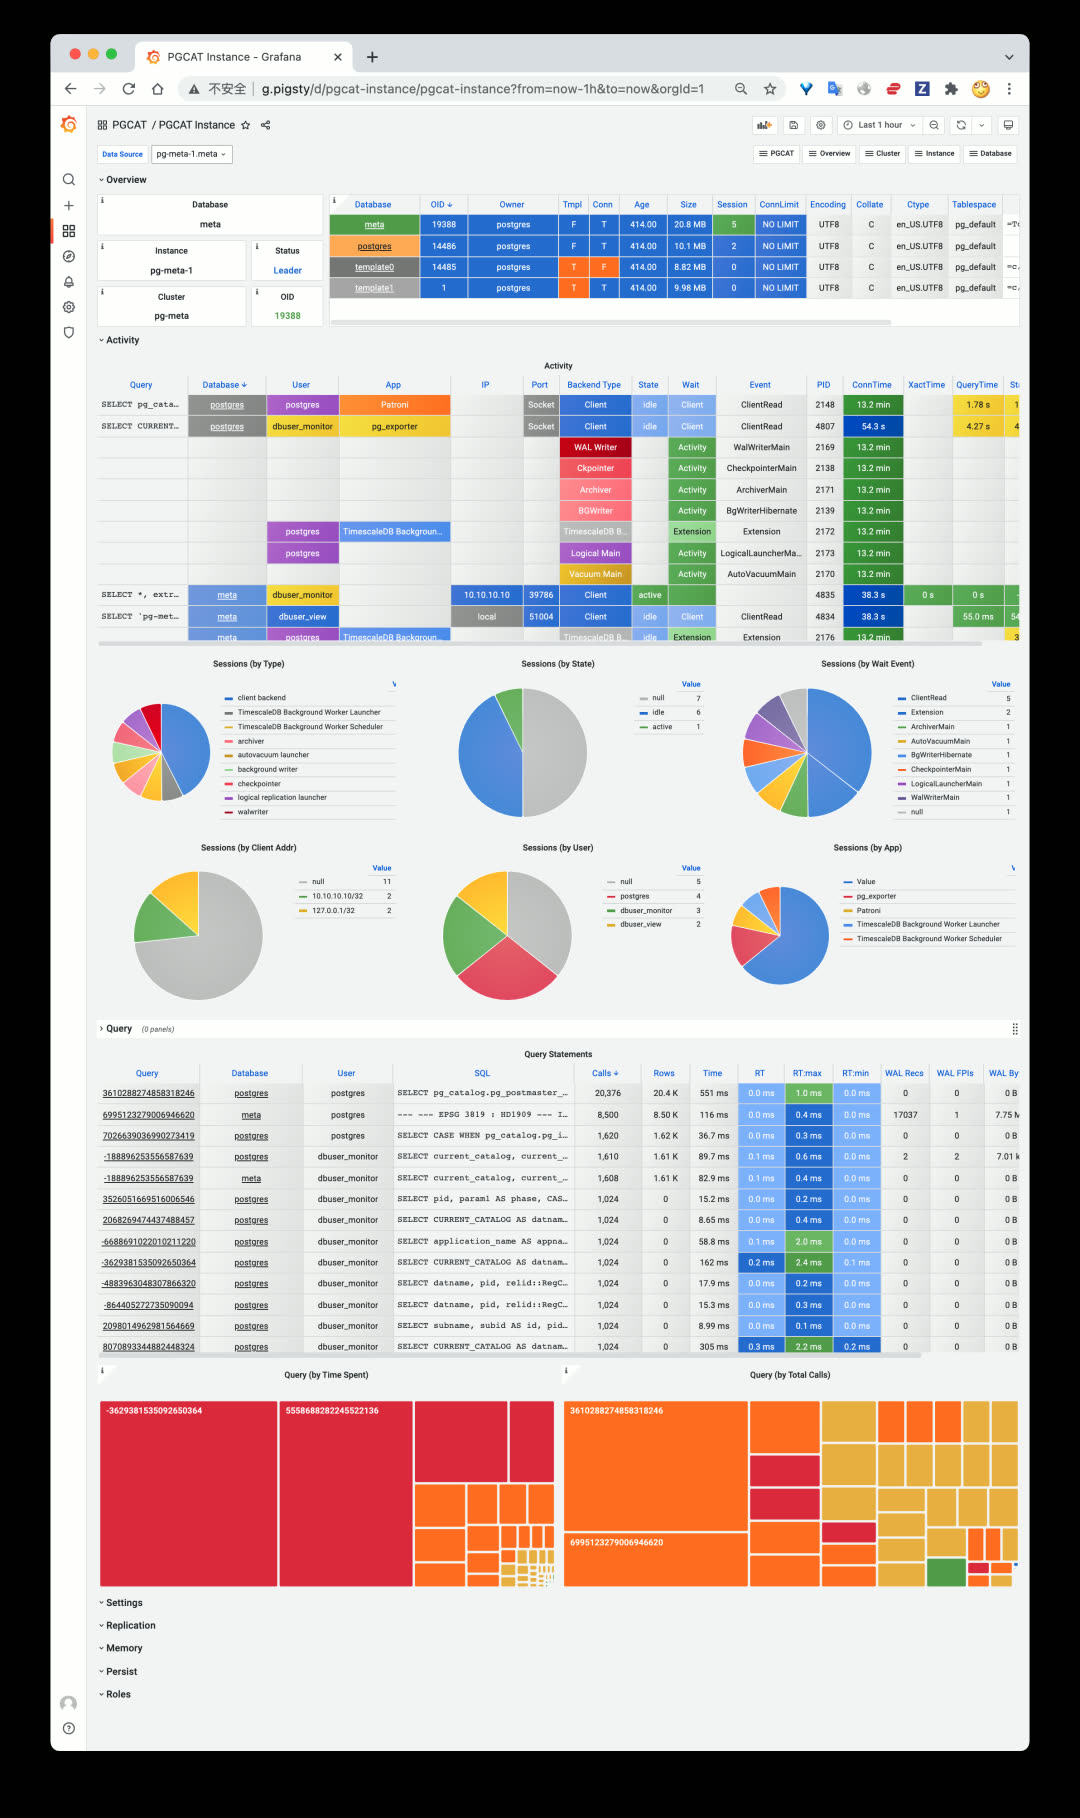
Single PostgreSQL instance catalog info: databases, active sessions, running queries.
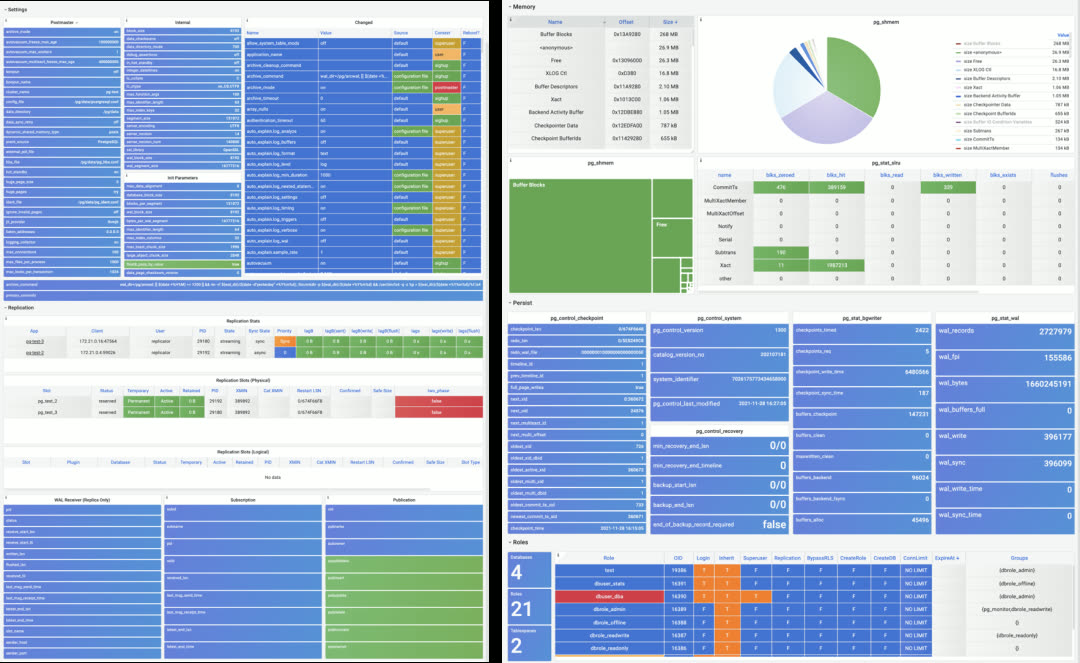
More instance-level catalog info: configuration, replication, memory usage, persistence, roles.
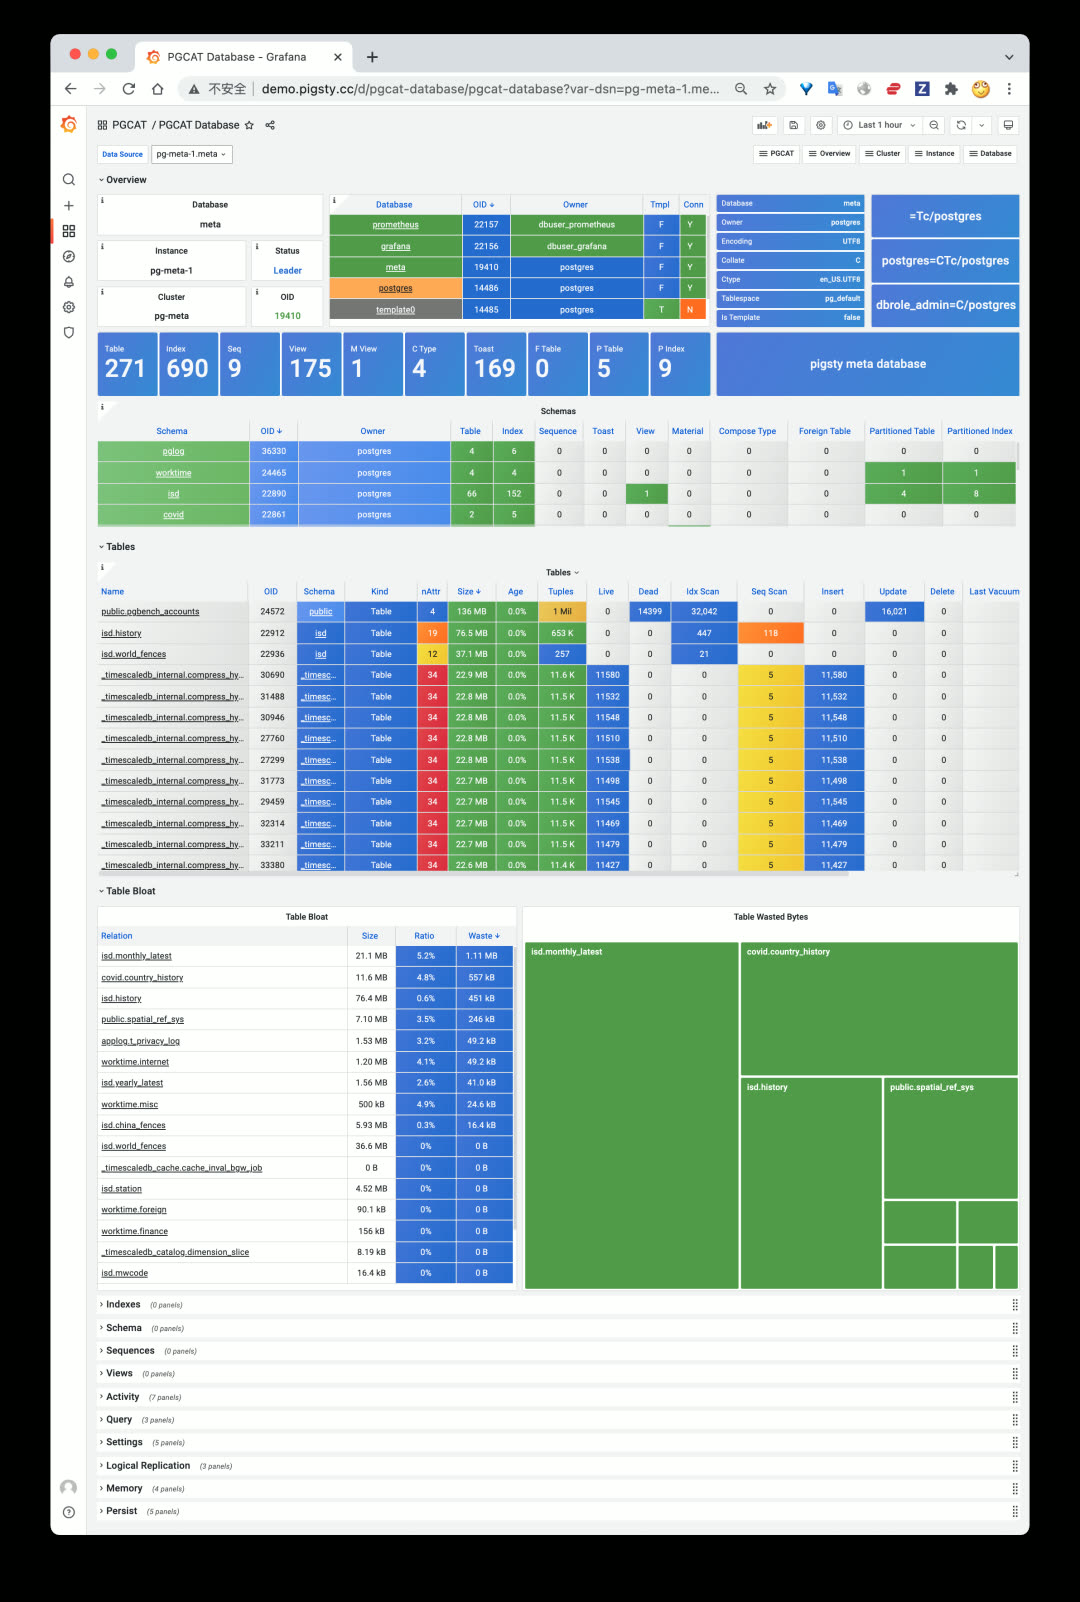
Single PostgreSQL database catalog info, including schemas, tables, indexes, sequences, and other objects.
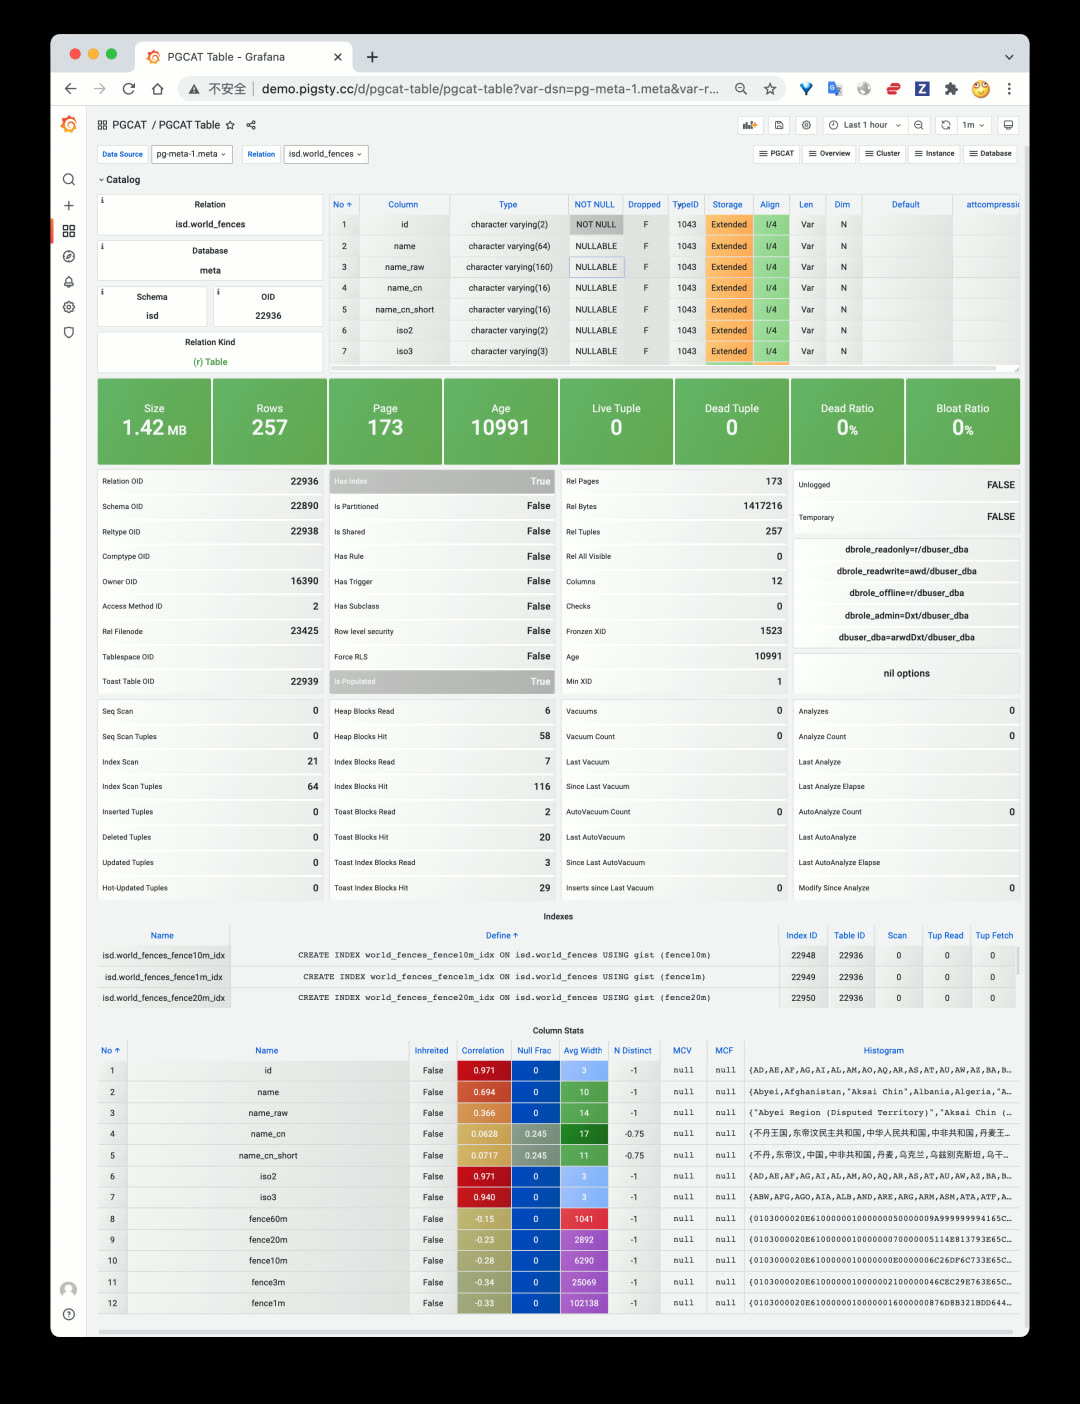
Redesigned PGCAT TABLE dashboard with detailed per-column statistics.
Agentless Design
PGCAT only needs a target database URL — no agent installation required. Even monitor-only deployments of existing instances get full PGCAT functionality.
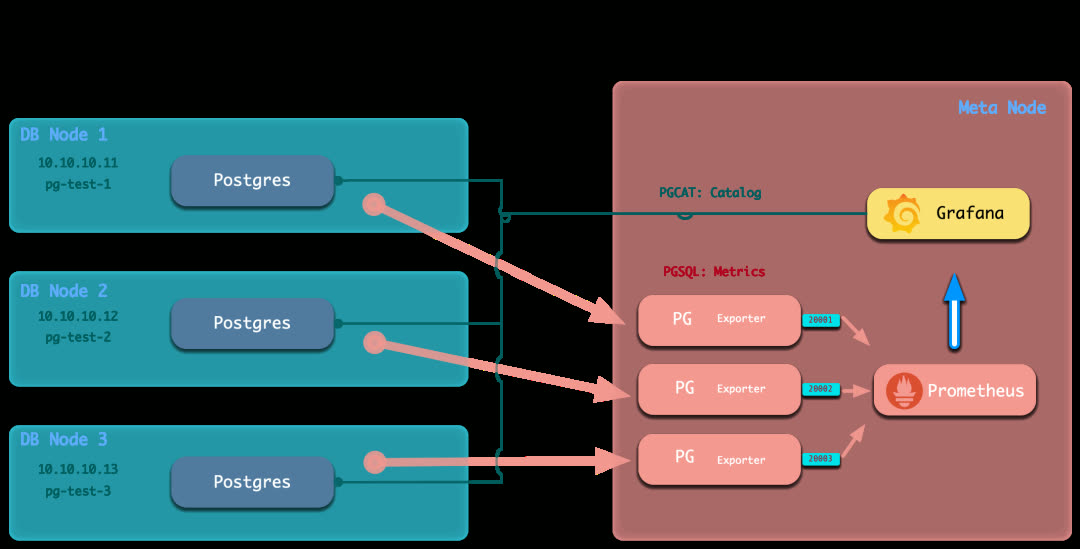
In Pigsty v1.3’s monitor-only deployment mode, external PostgreSQL instances are also registered in Grafana with PGCAT enabled by default.
PGSQL Enhancements
The core PGSQL monitoring application also received significant improvements.
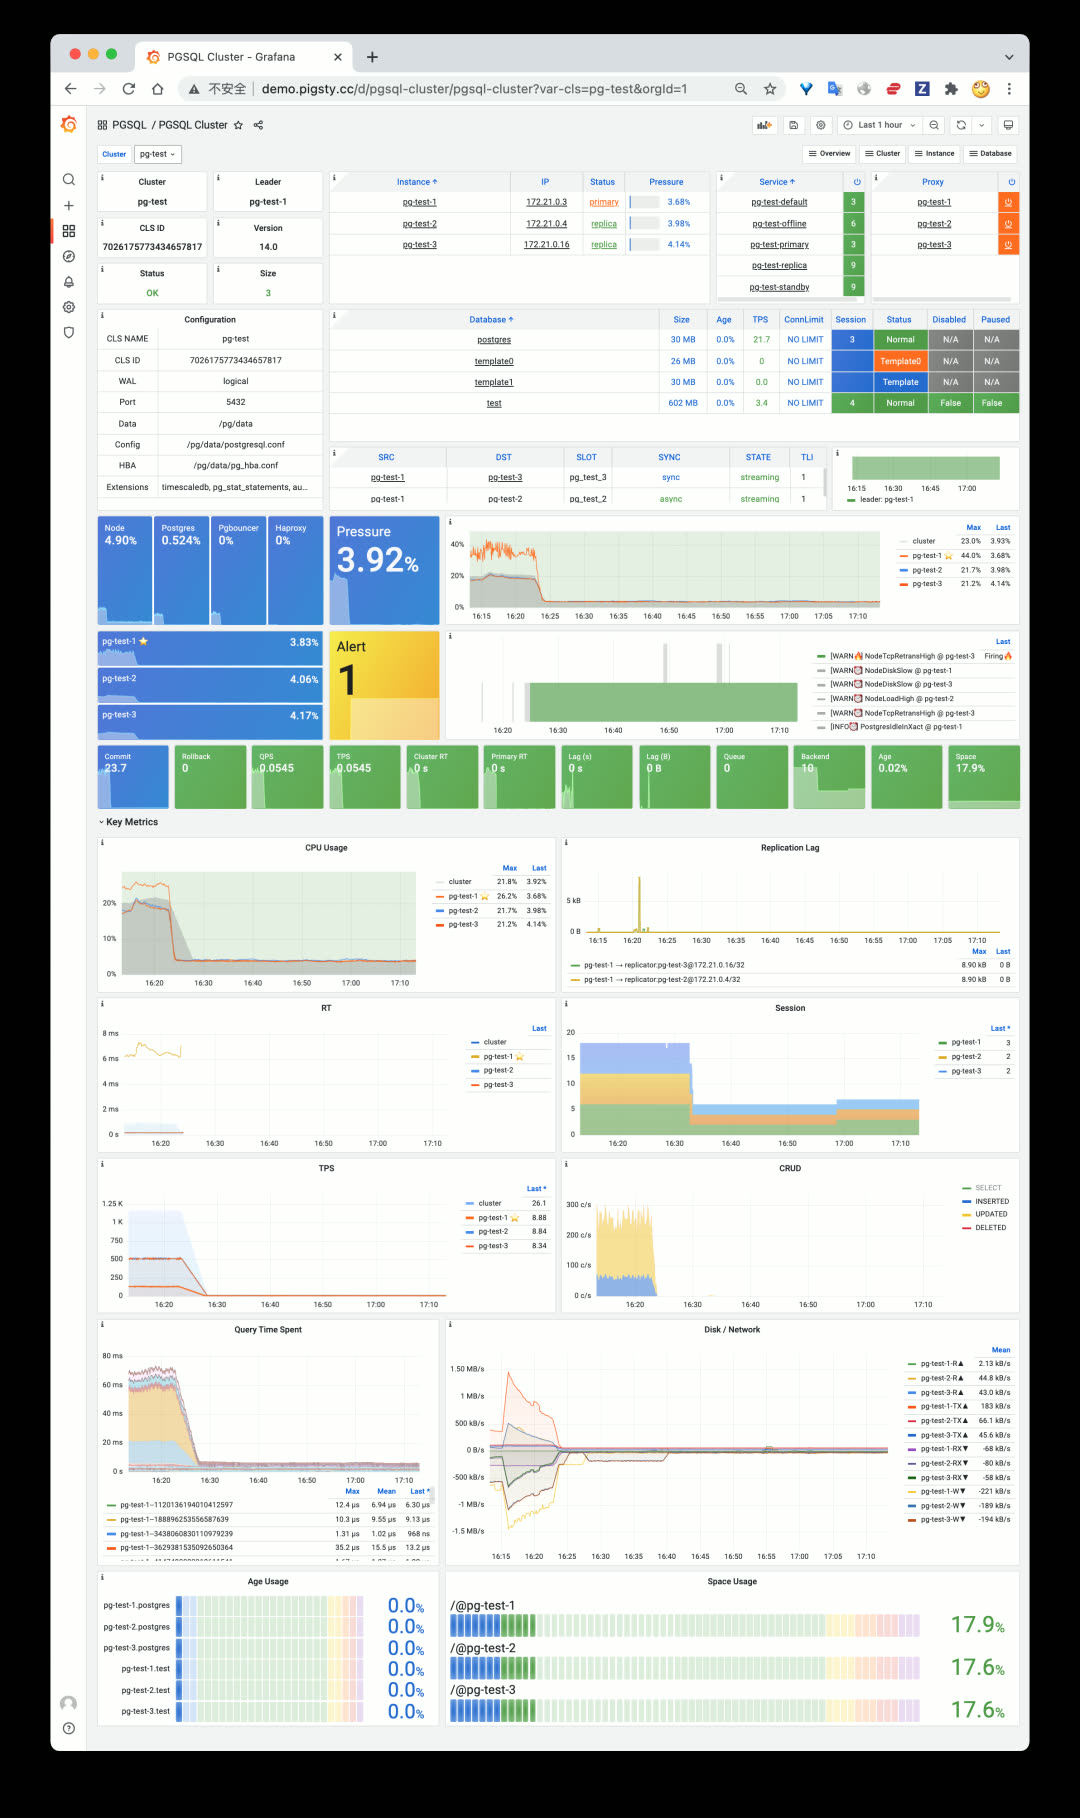
In Pigsty v1.3, the PGSQL Cluster dashboard adds quick-navigation panels for 10 key metrics.
Both PGSQL Instance and PGSQL Cluster now include quick-navigation panels for rapid problem identification. PGSQL Service was completely redesigned — simpler and more intuitive for quickly understanding cluster topology. Other dashboards also received optimizations and improvements.
Additionally, v1.3 includes improvements to the semi-automated database migration playbook and profiling tool support.
v1.3.0 Release Notes
Redis Support
| Feature | Description |
|---|---|
| Redis Deployment | Standalone, Sentinel, and Cluster modes |
| Redis Monitoring | Overview, Cluster, and Instance dashboards |
PGCAT Overhaul
| Dashboard | Description |
|---|---|
| PGCAT Instance | New instance-level catalog dashboard |
| PGCAT Database | New database-level catalog dashboard |
| PGCAT Table | Redesigned table-level dashboard |
PGSQL Enhancements
| Dashboard | Improvements |
|---|---|
| PGSQL Cluster | Added 10 key metric panels |
| PGSQL Instance | Added 10 key metric panels |
| PGSQL Service | Simplified and redesigned |
| Cross-references | Navigation links between PGCAT and PGSQL dashboards |
Monitor Deployment
- Grafana datasources auto-register during monitor-only deployment
Software Upgrades
- PostgreSQL 13 added to default package list
- PostgreSQL upgraded to 14.1 as default
- Added Greenplum RPM packages and dependencies
- Added Redis RPM and source packages
- Added
perfas default package
v1.3.1 Release Notes
Monitoring
- PGSQL & PGCAT dashboard improvements
- Optimized PGCAT Instance & PGCAT Database layout
- Added key metric panels to PGSQL Instance dashboard (consistent with PGSQL Cluster)
- Added table/index bloat panels to PGCAT Database, removed PGCAT Bloat dashboard
- Added index information to PGCAT Database dashboard
- Fixed broken panels in Grafana 8.3
- Added Redis index to Nginx homepage
Deployment
- New
infra-demo.ymlplaybook for one-click bootstrap - New
infra-jupyter.ymlplaybook for optional JupyterLab server - New
infra-pgweb.ymlplaybook for optional PGWeb server - Added
pgalias on meta node for starting PostgreSQL cluster from admin user - Adjusted
max_locks_per_transactionsin all Patroni config templates pertimescaledb-tunerecommendations - Added
citus.node_conninfo: 'sslmode=prefer'to config templates for SSL-free Citus usage - Added all extensions (except pgrouting) from PGDG14 to package list
- Upgraded node_exporter to v1.3.1
- Added PostgREST v9.0.0 for generating REST APIs from PostgreSQL schemas
Bug Fixes
- Grafana security vulnerability fix (upgraded to v8.3.1, details)
- Fixed
pg_instance&pg_serviceissues inregisterrole when starting playbook mid-run - Fixed Nginx homepage rendering on hosts without
pg_clustervariable - Fixed style issues when upgrading to Grafana 8.3.1
2.4 - Pigsty v1.2: PG14 Default, Monitor Existing PG
Originally published on VONNG.

Pigsty v1.2 is officially released, making PostgreSQL 14 the default version and adding support for monitoring existing database instances independently.
PostgreSQL 14 Becomes the Default
PostgreSQL 14 was released last month with significant improvements across the board, especially in observability. After deployment and thorough testing in multiple production environments, PostgreSQL 14 is now Pigsty’s default database version.
Meanwhile, the time-series extension TimescaleDB 2.5 and geospatial extension PostGIS 3.1, both compatible with PG14, are now installed and enabled by default. Combined with the distributed database extension Citus 10, this delivers a truly batteries-included space-time hyper-converged open-source PostgreSQL distribution.
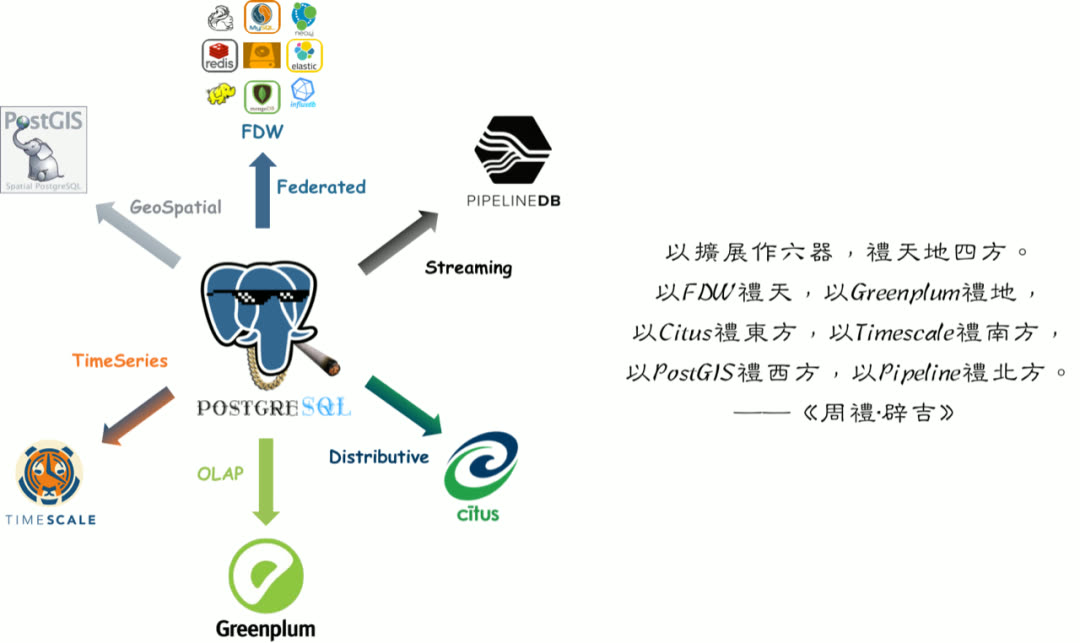
All three are mutually compatible and can be used together.
Monitor-Only Deployment Mode
The second major feature is monitor-only deployment mode. Previously, Pigsty as a distribution tightly coupled its monitoring system with its deployment solution. However, many users want to use only Pigsty’s monitoring system to monitor existing database instances, cloud databases, or other RDS products and derivatives.
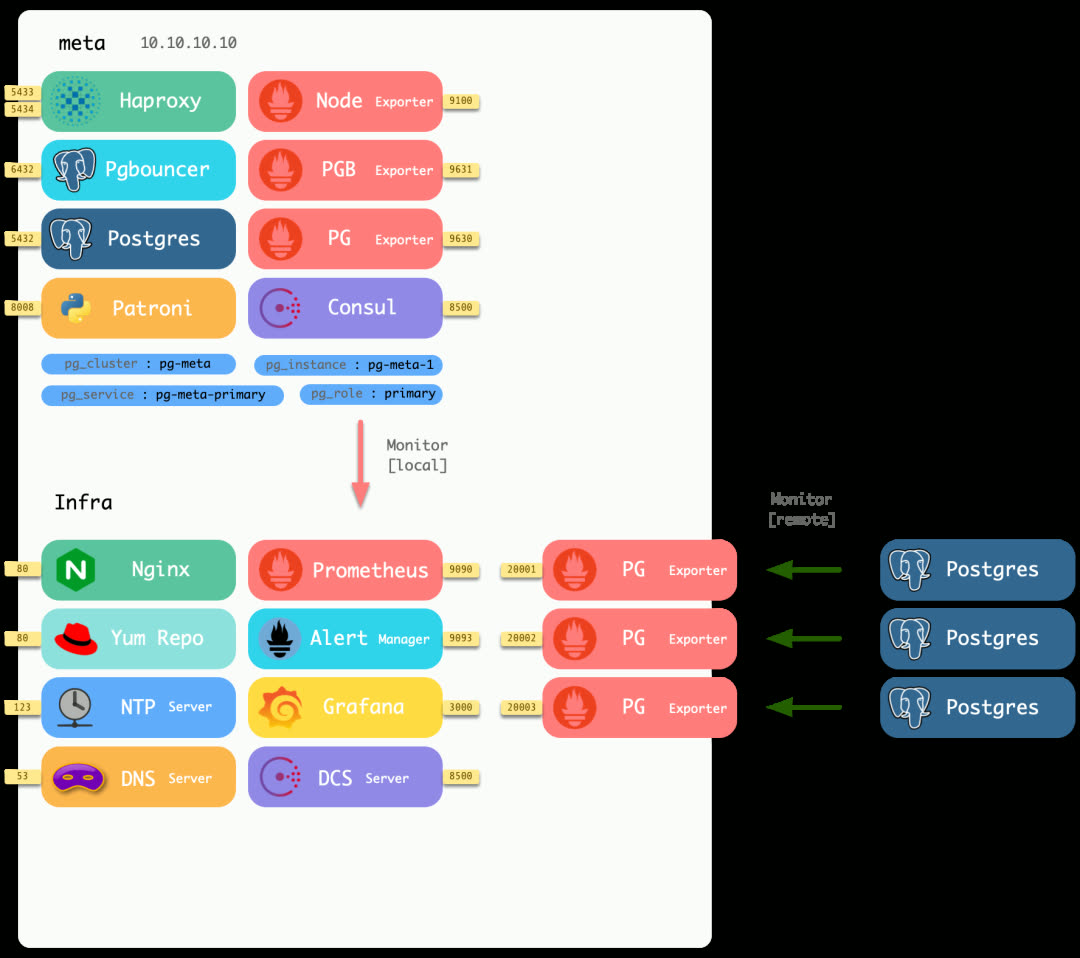
Minimal deployment mode runs pg_exporter on different local ports to monitor external PostgreSQL instances.
In v1.2, Pigsty offers three optional monitoring deployment modes:
| Mode | Description |
|---|---|
| Full | Complete Pigsty deployment with monitoring and control |
| Lean | Deploy only monitoring-related components |
| Minimal | Only requires a database connection string, no remote machine access needed |
The new minimal deployment mode no longer requires login or admin privileges on remote machines — as long as you have a connection string with read-only access to the remote database, you can add it to monitoring. All monitoring functionality is consolidated on a single machine, making management simple and convenient.
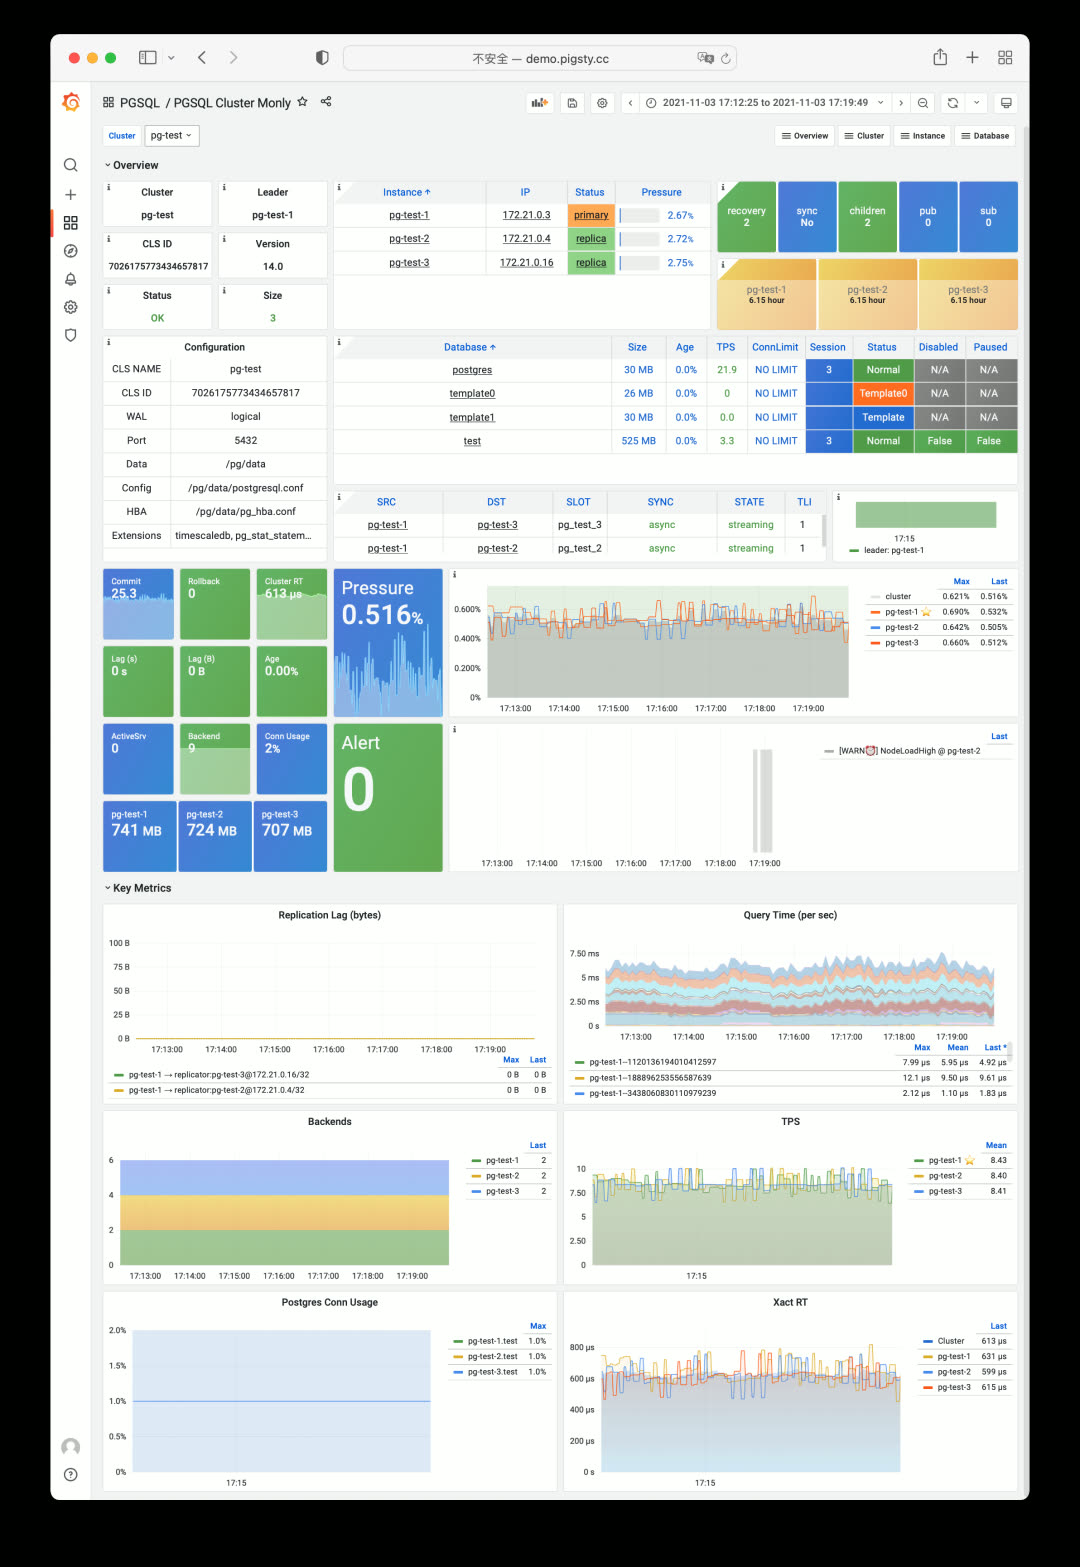
Although you only get PostgreSQL metrics, most of Pigsty’s monitoring system functionality still works. Testing shows Pigsty can also directly monitor MatrixDB, Greenplum, and other PostgreSQL-derived/compatible database products.
Streamlined Configuration Templates
Configuration templates have been further streamlined: now there are only two templates — Production (default) and Sandbox.
Spec parameter templates are now richer, providing smooth transition options:
| Spec | Config | Description |
|---|---|---|
| tiny | 1C1G | Minimal testing spec |
| mini | 2C4G | Development environment spec |
| small | 4C8G | Small production spec |
| medium | 8C16G | Medium production spec |
| large | 16C32G | Large production spec |
| oltp/olap/crit | 64C400G | Professional production spec |
During configuration, the setup wizard automatically selects the appropriate parameter template based on machine specs.
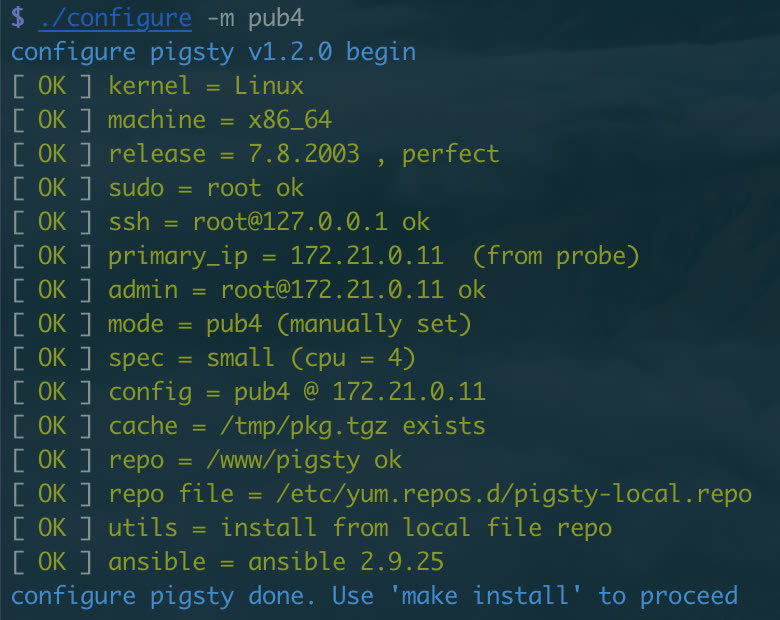
Pigsty maintains its tradition of one-liner installation: ./configure && make install.
Utility Playbooks
The new pgsql-migration playbook auto-generates the commands, scripts, and documentation needed for database migration, making online zero-downtime migrations based on logical replication simple (already used to migrate dozens of databases in production).
The pgsql-audit playbook generates audit reports for database instances based on audit requirements.
Sample Applications
v1.2 provides two new Pigsty App examples:
AppLog — An app for visualizing Apple iOS 15 privacy logs, showing which apps accessed which permissions.
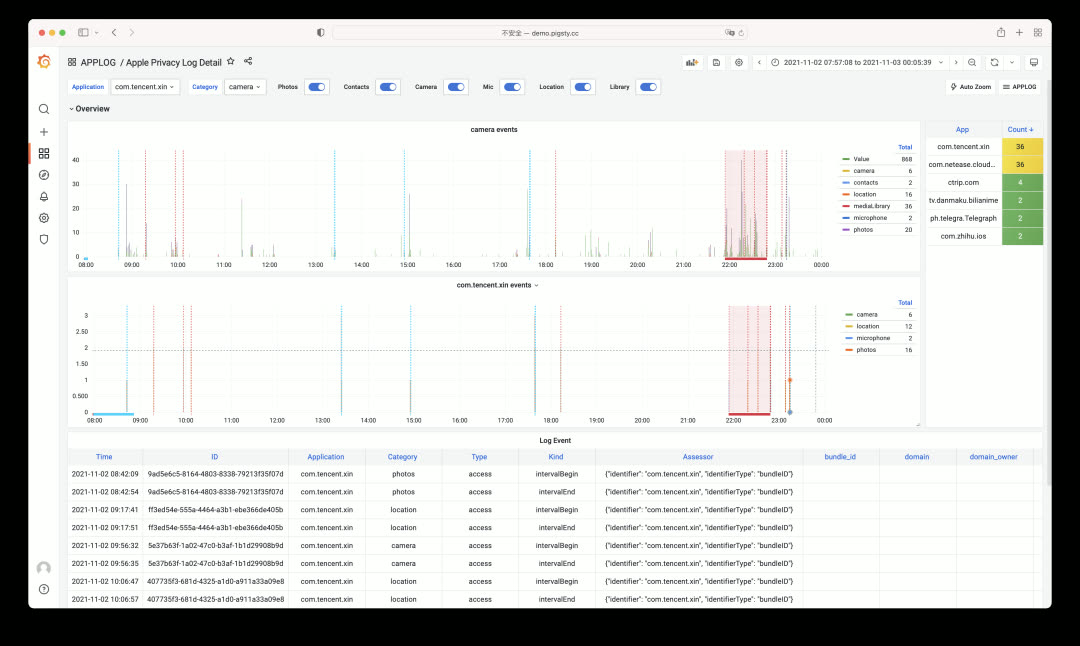
WorkTime — An app for querying work and rest hours at major tech companies.
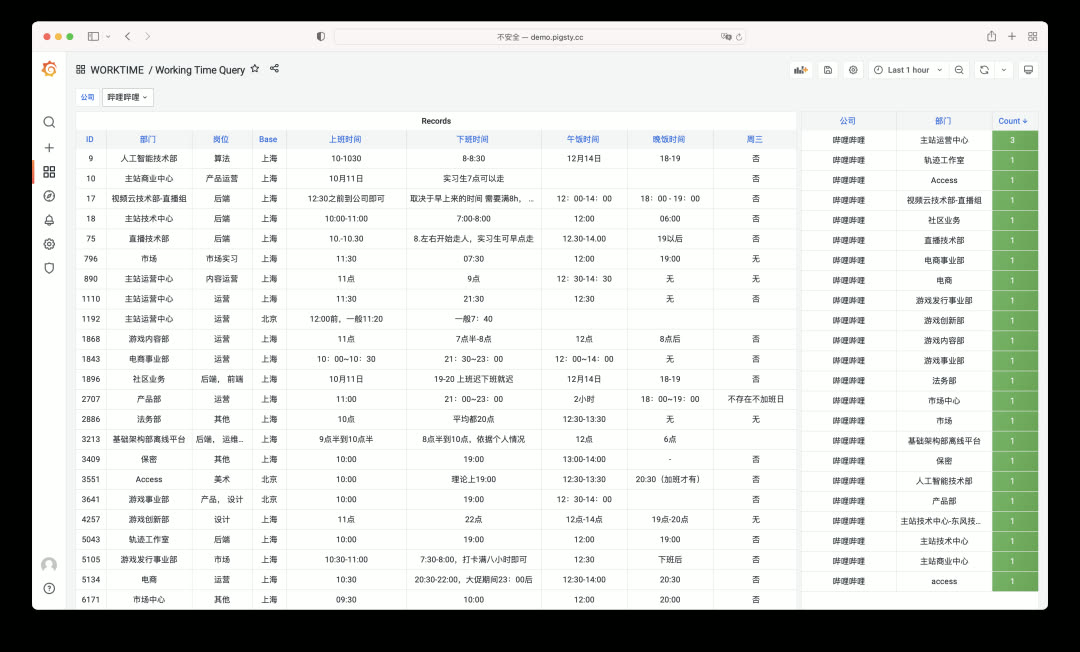
Both apps are simple but practical, each built in under an hour. Pigsty is an excellent tool for rapidly prototyping functional applications.
Looking Ahead
PGSQL v8 — More clearly organized monitoring dashboards with role-specific views for different user groups.
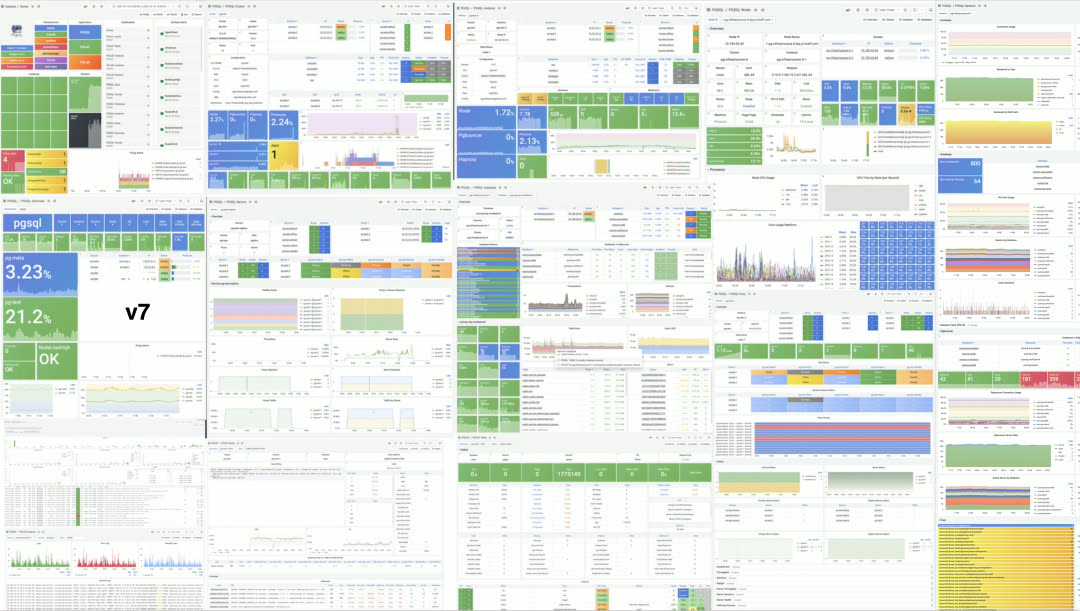
PGCAT v2 — Richer system catalog navigation and browsing functionality.
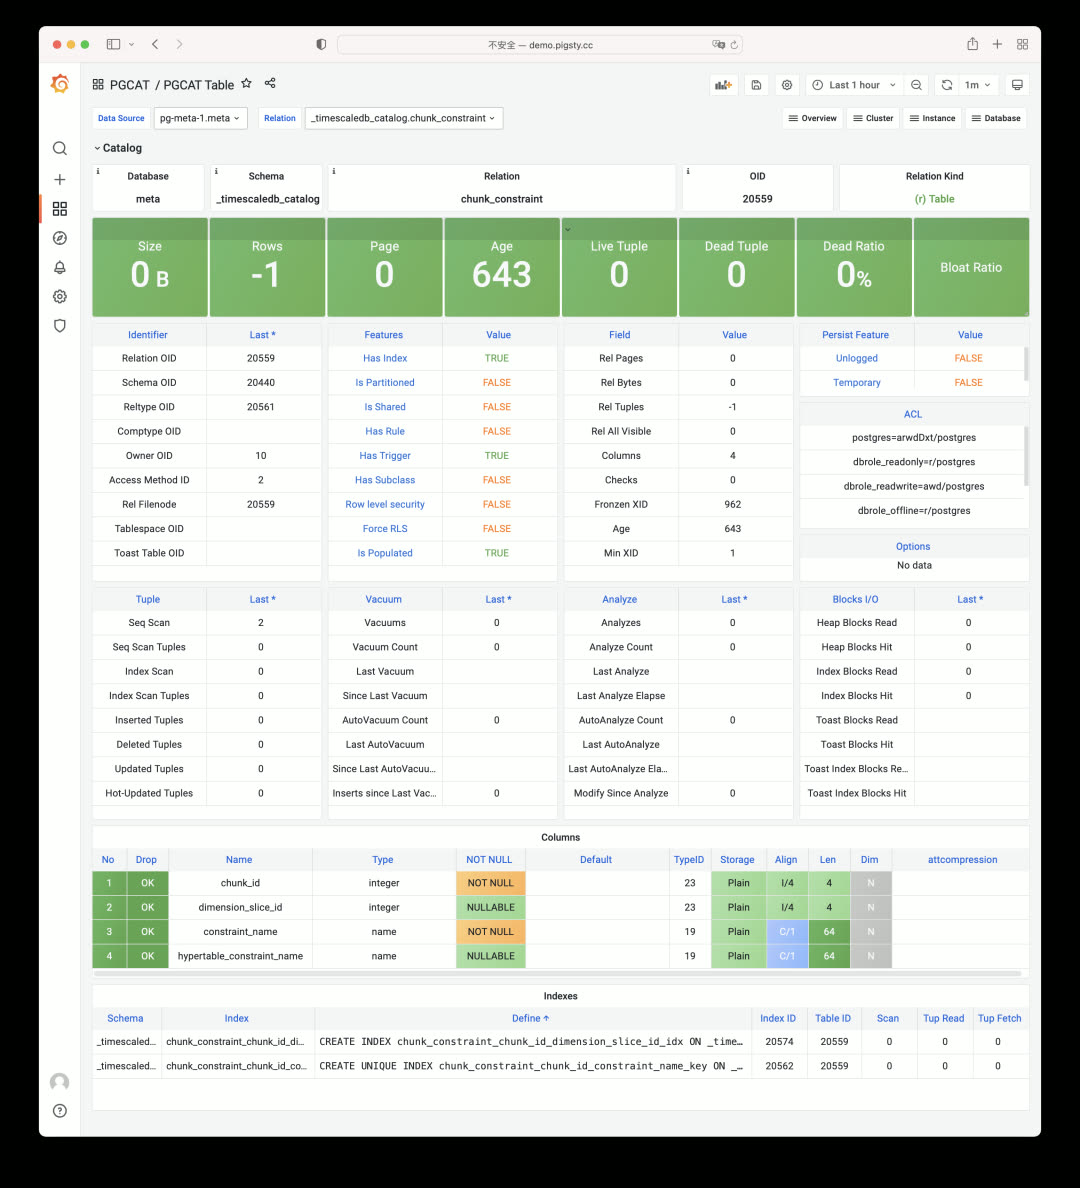
REDIS v1beta — Redis is often used alongside PostgreSQL; future versions will integrate Redis deployment and monitoring as a complete solution.
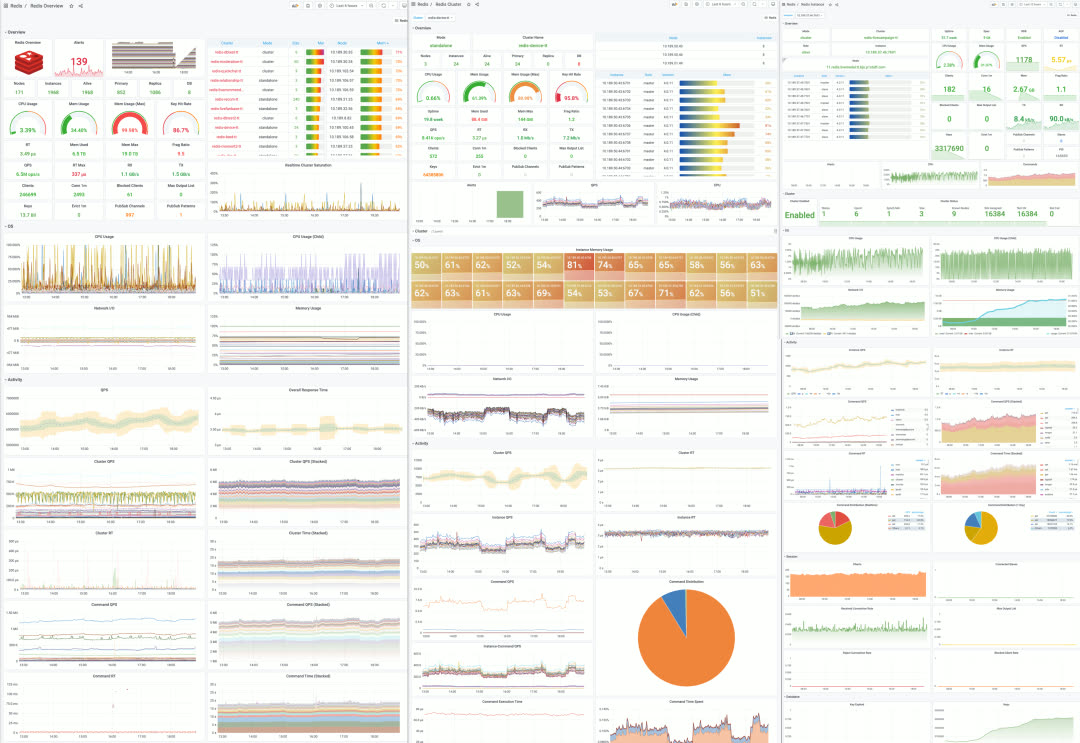
v1.2.0 Release Notes
Core Features
- Default to PostgreSQL 14
- Default to TimescaleDB 2.5 extension
- TimescaleDB and PostGIS enabled by default in CMDB
Monitor-Only Mode
- Monitor existing PostgreSQL instances via connection URL only
- pg_exporter deployed on local meta node
- New PGSQL Cluster Monly dashboard for remote clusters
Software Upgrades
- Grafana upgraded to 8.2.2
- pev2 upgraded to v0.11.9
- Promscale upgraded to 0.6.2
- PgWeb upgraded to 0.11.9
- New extensions: pglogical, pg_stat_monitor, orafce
Improvements
- Auto-detect machine specs and use appropriate
node_tuneandpg_conftemplates - Reworked bloat-related views, exposing more information
- Removed TimescaleDB and Citus internal monitoring
- Added
pgsql-audit.ymlplaybook for creating audit reports - All config templates simplified to two: auto and demo
Bug Fixes
- pgbouncer_exporter resource owner changed to
{{ pg_dbsu }}instead of postgres - Fixed pg_exporter duplicate metrics on pg_table/pg_index during
REINDEX TABLE CONCURRENTLY
Upgrade Notes
No API changes in v1.2.0 — existing pigsty.yml config files (PG13) still work. For infrastructure, re-running repo will handle most updates.
For databases, you can continue using existing PG13 instances. When PostGIS and TimescaleDB extensions are involved, in-place upgrades are complex — logical replication migrations are recommended. The new pgsql-migration.yml playbook generates scripts to help achieve near-zero-downtime cluster migrations.
2.5 - Pigsty v1.1: Homepage, Jupyter, Pev2, PgBadger
Originally published on VONNG.

Pigsty v1.1 is officially released, featuring a brand-new homepage design, plus support for JupyterLab, PGWeb, PEV2, PgBadger, and other useful tools.
Brand New Homepage
The Home Dashboard in Grafana has long served as Pigsty’s de facto “homepage.” Now Pigsty finally has a standalone, well-designed homepage of its own.
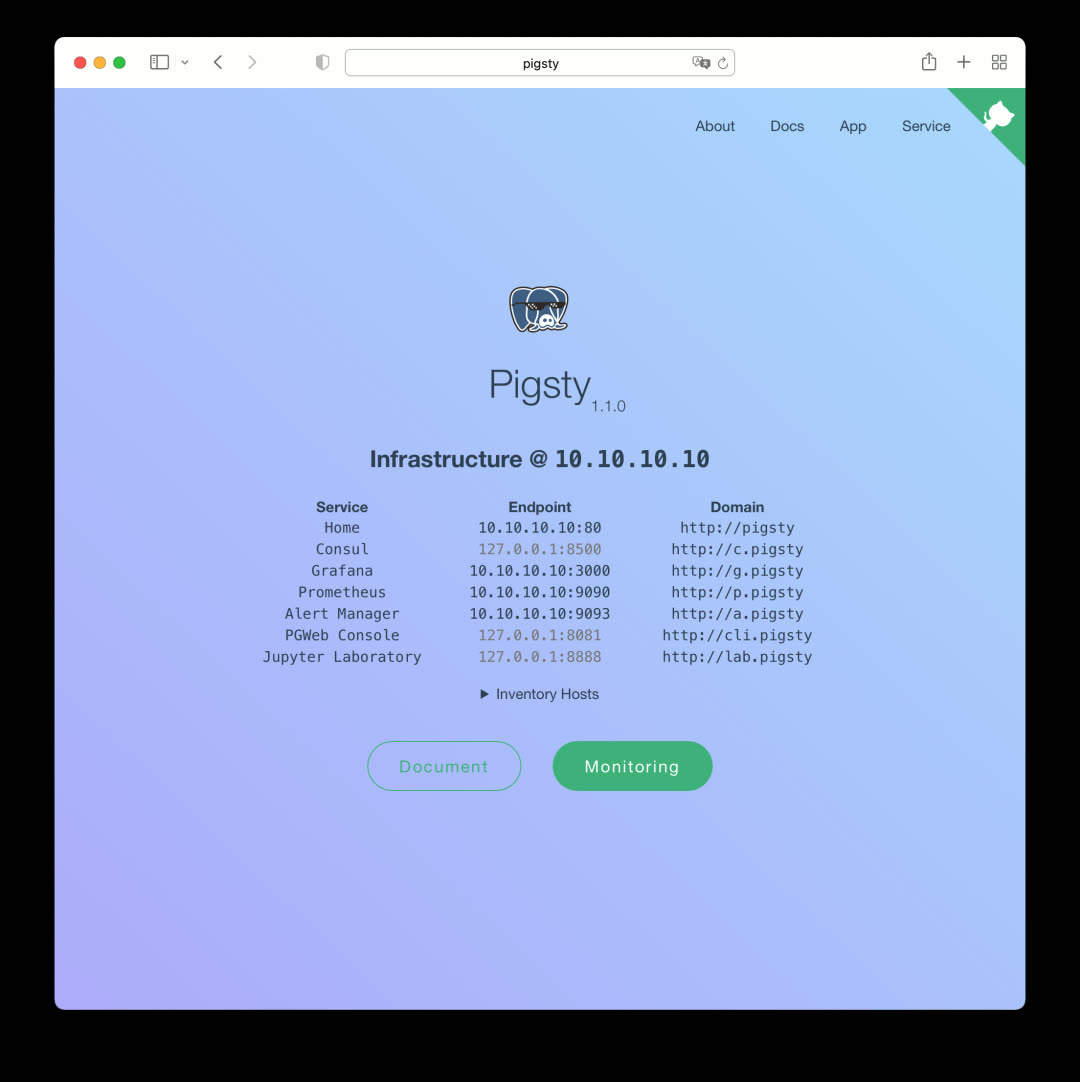
This homepage is a local version of the documentation site, served by the default Nginx.
Service Navigation
The homepage provides navigation to all Pigsty service components, including Consul, Grafana, Prometheus, AlertManager, and the newly introduced PGWeb and JupyterLab in v1.1. Click the component name/URL in the center, or use the Service dropdown menu in the top-right navigation bar.
Monitoring Navigation
The homepage can display clusters and instances in your Pigsty deployment (optional), with direct links to specific cluster/instance monitoring pages and admin interfaces.
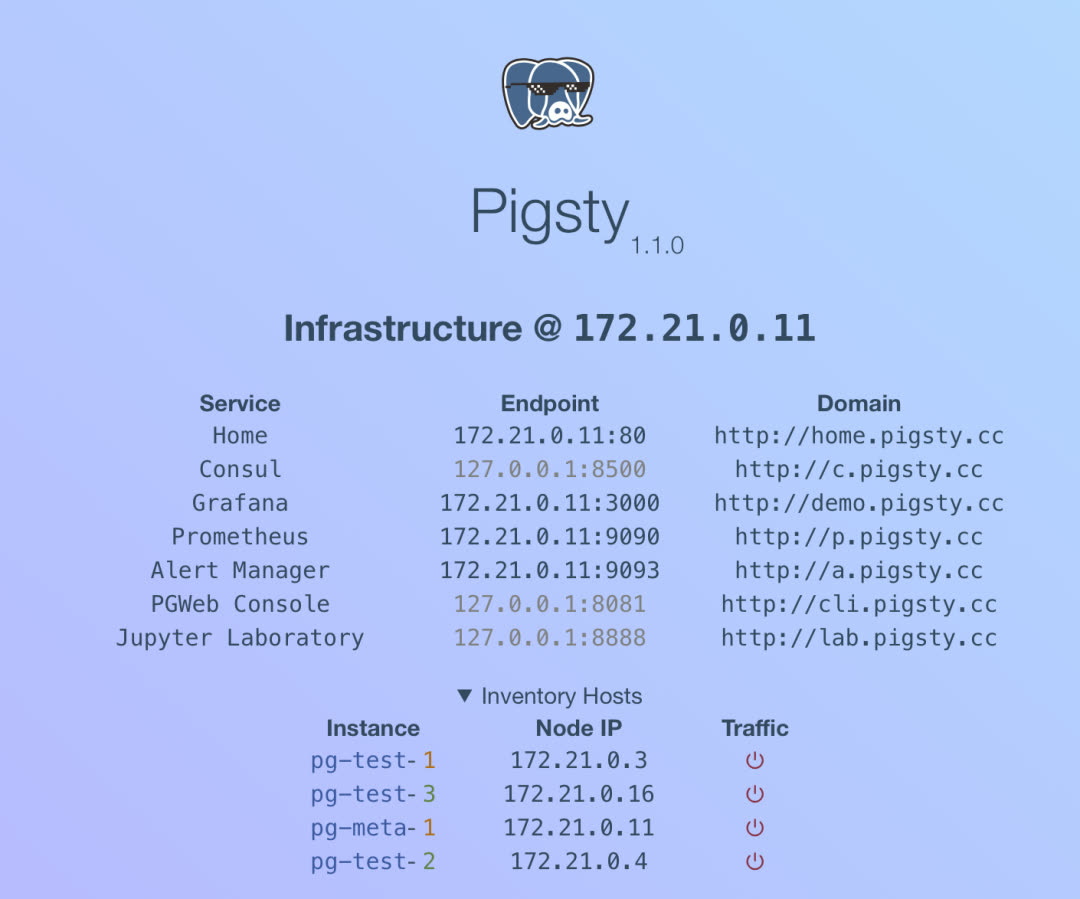
App Navigation
The App dropdown in the top-right corner is the entry point for Pigsty’s extended features. In v1.1, Pigsty ships with several useful and interesting apps, all configurable via options.
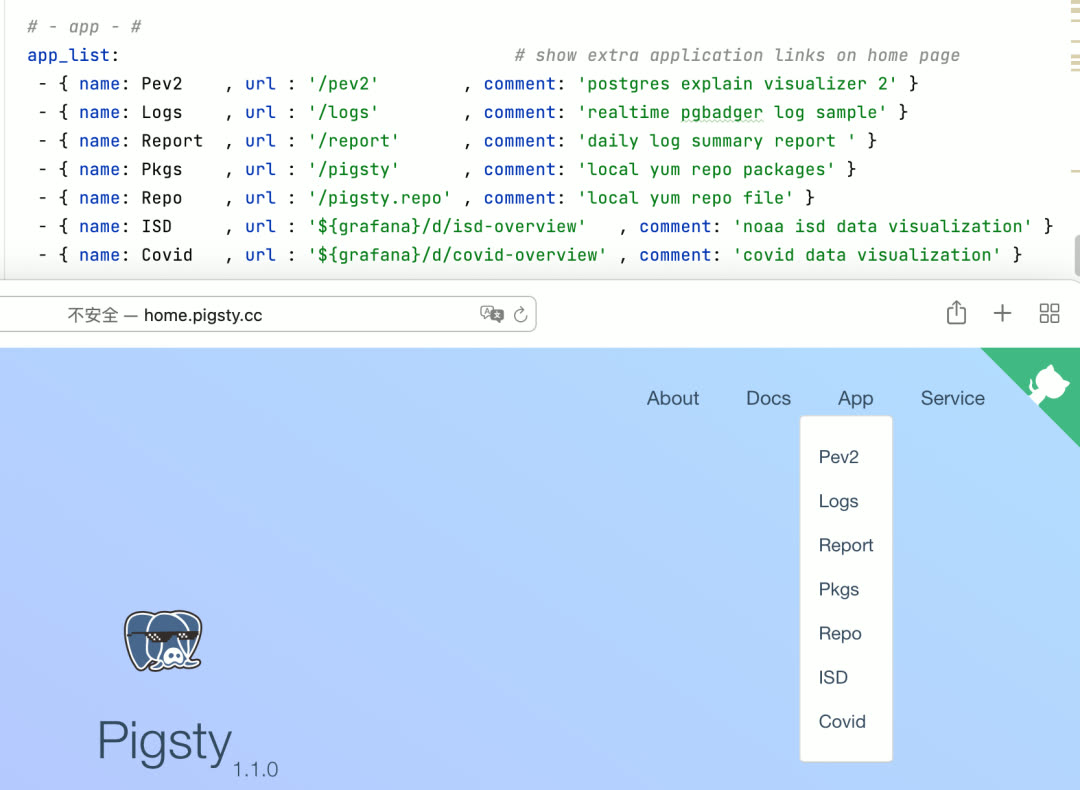
Local Documentation
In Pigsty v1.1, you can access local offline documentation directly from the homepage, available in both English and Chinese.
JupyterLab
If you use Python for data analysis, you’re probably familiar with Jupyter. Pigsty v1.0 bundled the JupyterLab package; v1.1 takes it further with native integration. JupyterLab is enabled by default in demo and personal configuration templates, but disabled by default in production deployments.
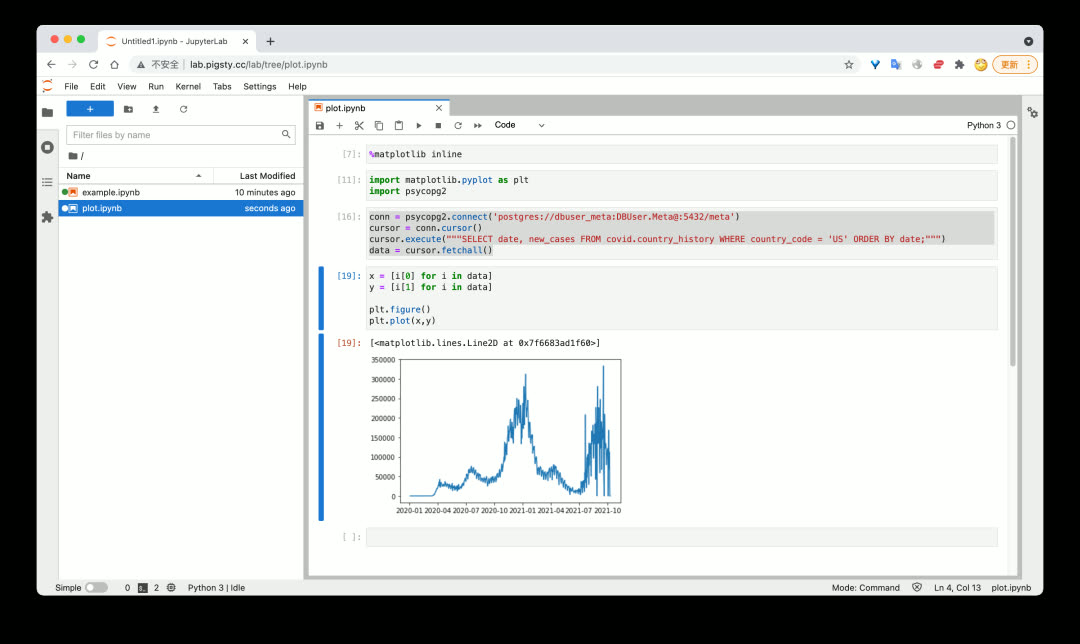
With Jupyter Notebook, you can efficiently and agilely extract, process, analyze, transform, and visualize data — combining the power of Python and SQL.
With great power comes great risk. Jupyter’s ability to execute arbitrary code is too risky for production environments, so it’s disabled by default in production configuration templates.
PGWeb
As a batteries-included database distribution, providing batteries-included GUI client tools is also important. PGWeb is a lightweight, browser-based PostgreSQL GUI client written in Go.
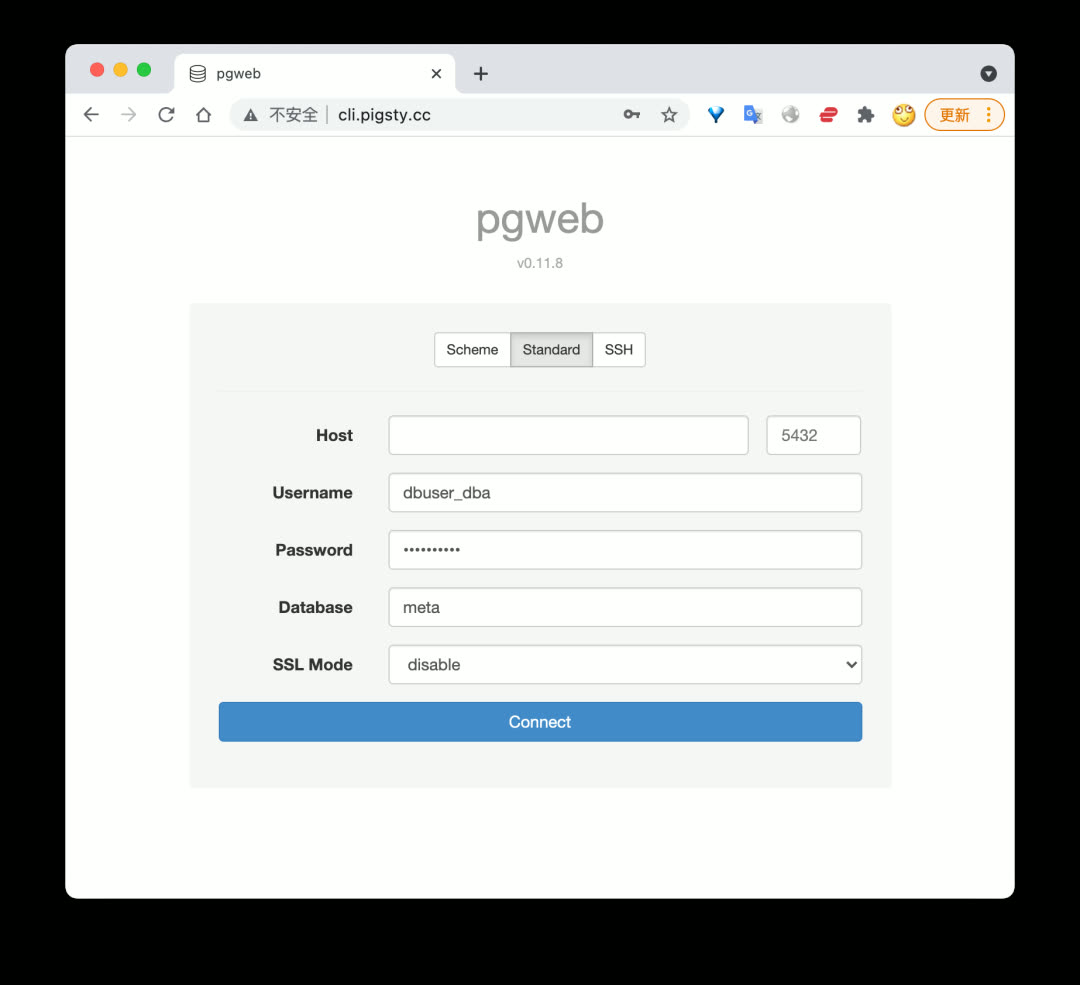
Like Jupyter, PGWeb is enabled by default in demo and personal configuration templates, but disabled in production deployments. However, PGWeb requires a connection string to access the database, making it relatively safe for scenarios where individual users need to query small amounts of data in production.
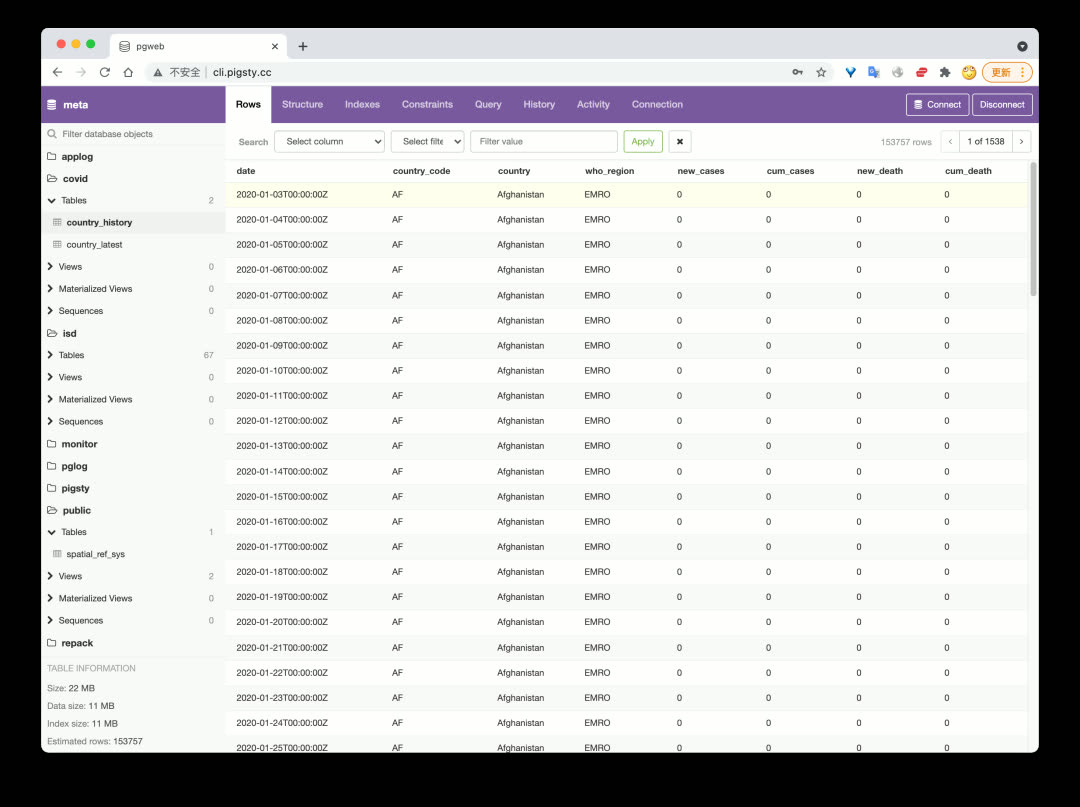
Users can browse schemas and objects in the database, quickly view table data, execute queries, and more.
PEV2
PEV2 is a handy execution plan visualizer that converts PostgreSQL EXPLAIN output into an intuitive execution plan tree.
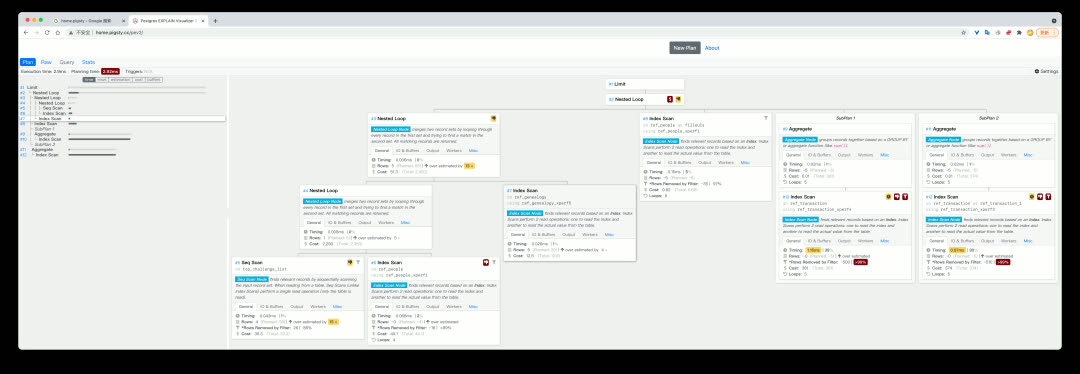
This tool is extremely useful for optimizing slow queries and analyzing auto_explain results.
PgBadger
PgBadger is an excellent PostgreSQL log analysis tool that quickly generates beautiful, comprehensive analysis reports from CSV logs.
Use bin/pglog-summary [ip] [date] to pull logs from a specific node on a specific date and create a log analysis report.
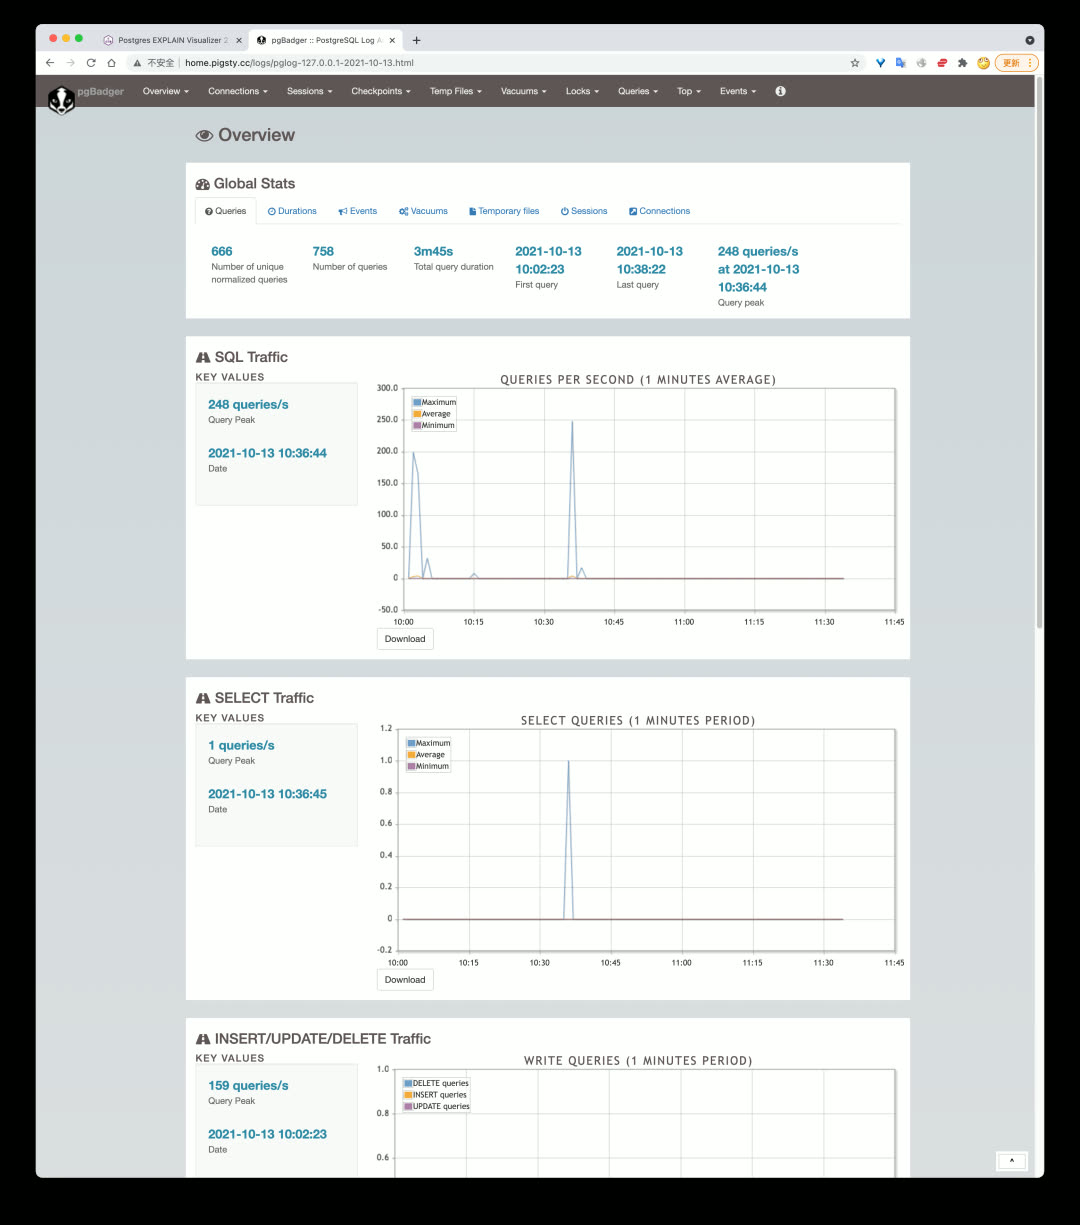
Add this command to crontab to automatically generate database operation reports daily or near-real-time.
Software Updates
PostgreSQL 14 is officially released, and Pigsty v1.1 immediately added support. The pigsty-pg14 template can now create PostgreSQL databases with version 14 as default in production. However, since TimescaleDB doesn’t officially support PG14 yet (expected around 10/30), PG14 won’t be the default database version in Pigsty for now.
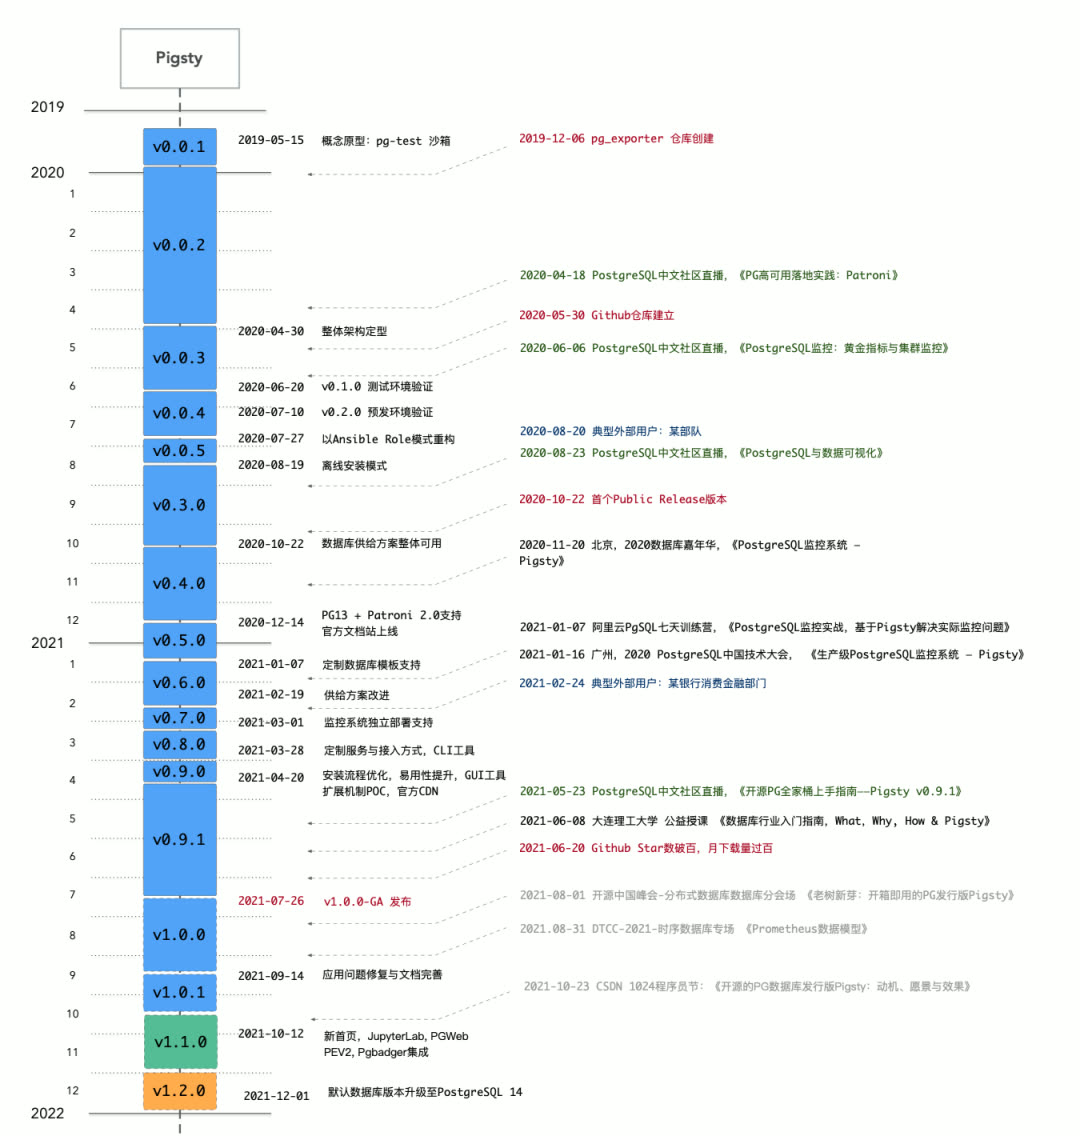
Pigsty will upgrade the default PG version to PG14 in v1.2.
Software upgrade list:
| Component | Version |
|---|---|
| PostgreSQL | v13.4 |
| pgbouncer | v1.16 |
| Grafana | v8.1.4 |
| Prometheus | v2.29 |
| node_exporter | v1.2.2 |
| HAProxy | v2.1.1 |
| Consul | v1.10.2 |
| vip-manager | v1.0.1 |
Database Migration Playbook
Pigsty includes a built-in database online migration helper script: pgsql-migration.yml, providing an out-of-the-box zero-downtime database migration solution based on logical replication.
Fill in the source and target cluster information, and the playbook will automatically generate the scripts needed for migration — just execute them in sequence.
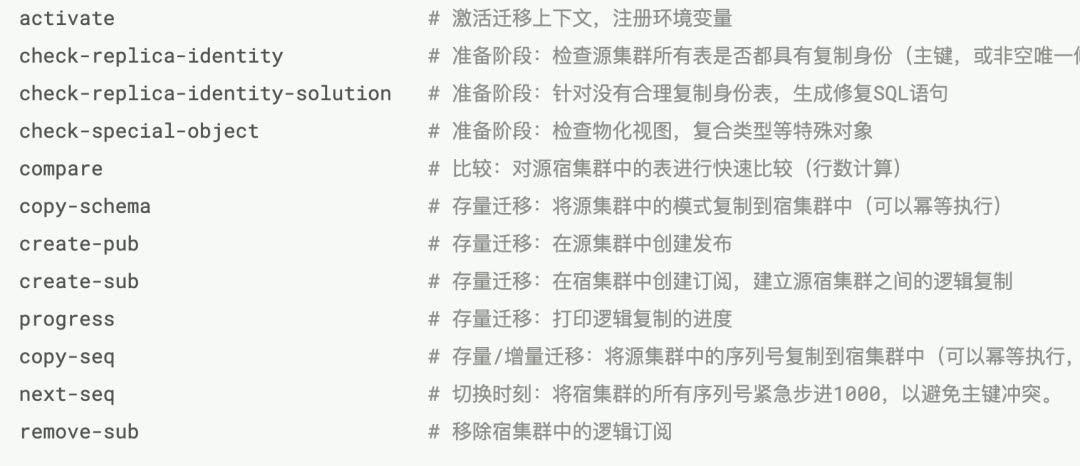
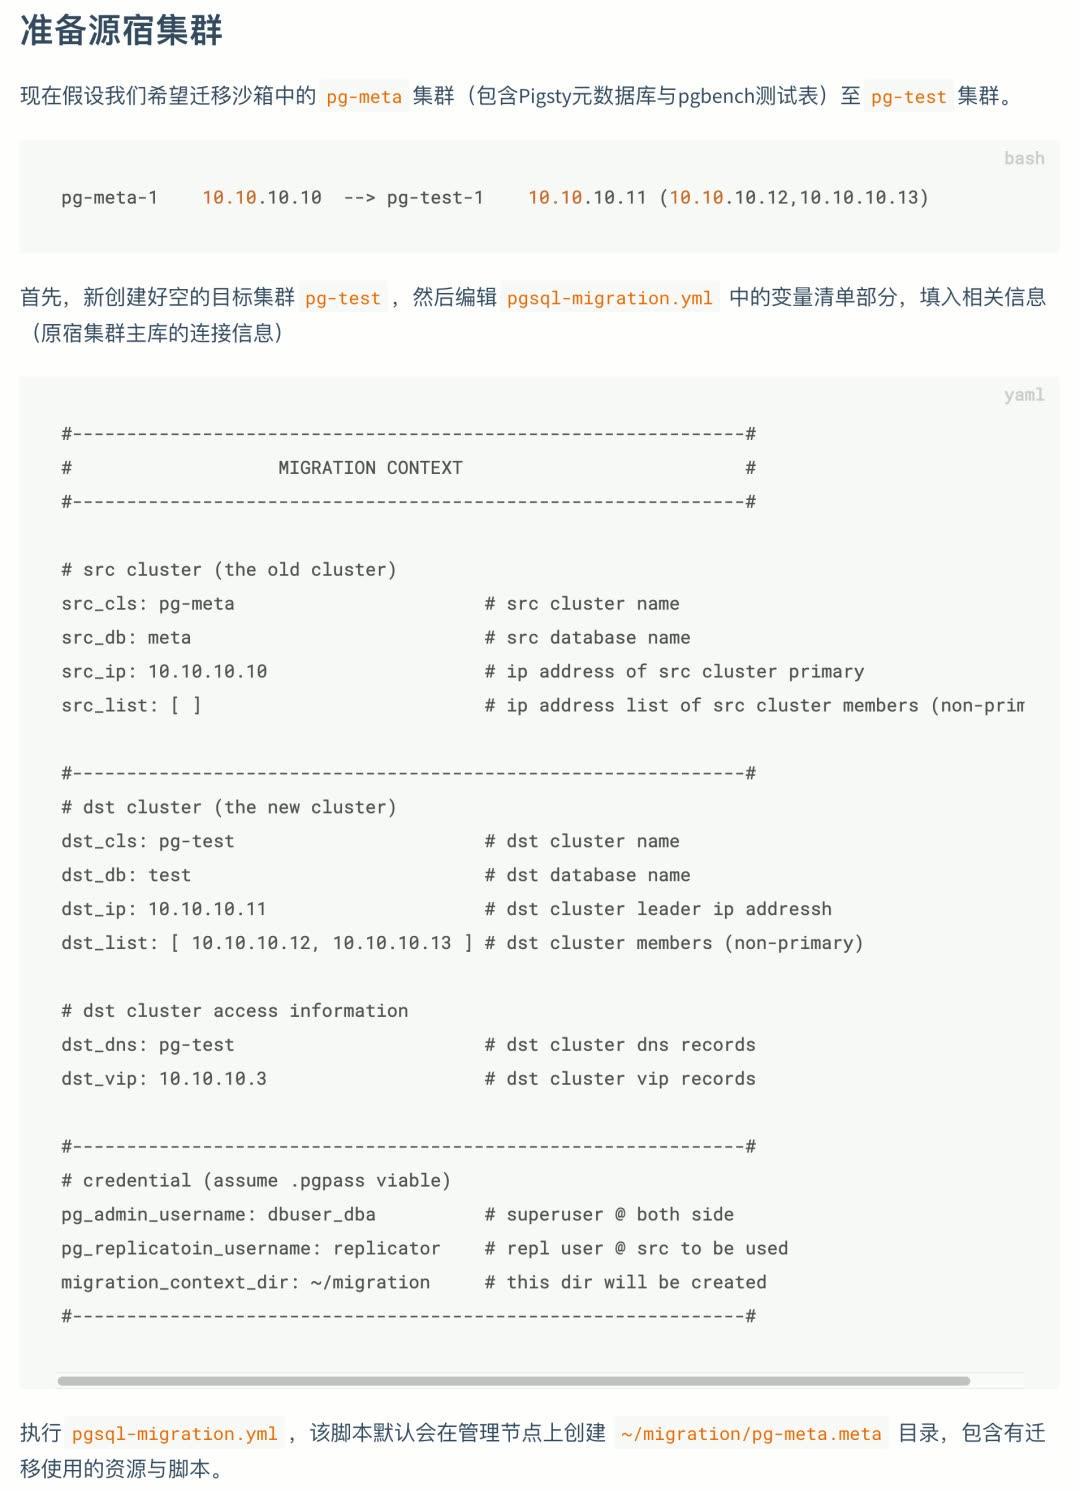
Sample App: Privacy Log Visualization
Pigsty’s default demo apps now include a new one: Apple App Privacy Log Visualization (AppLog). Export privacy access records from iOS 15 and visualize them in this app.
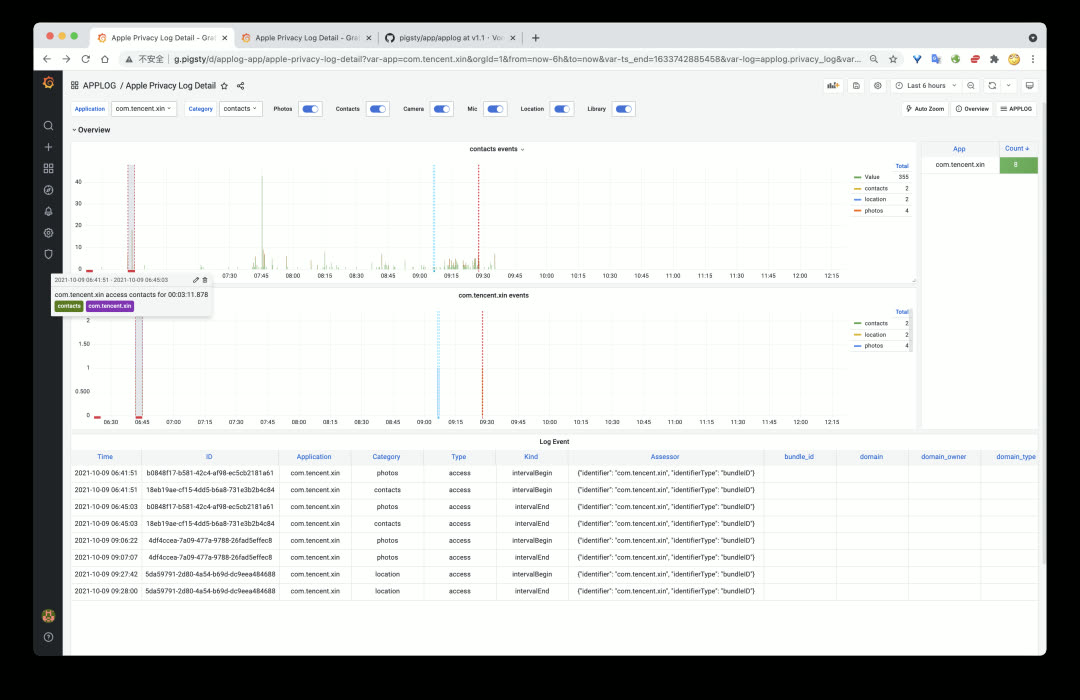
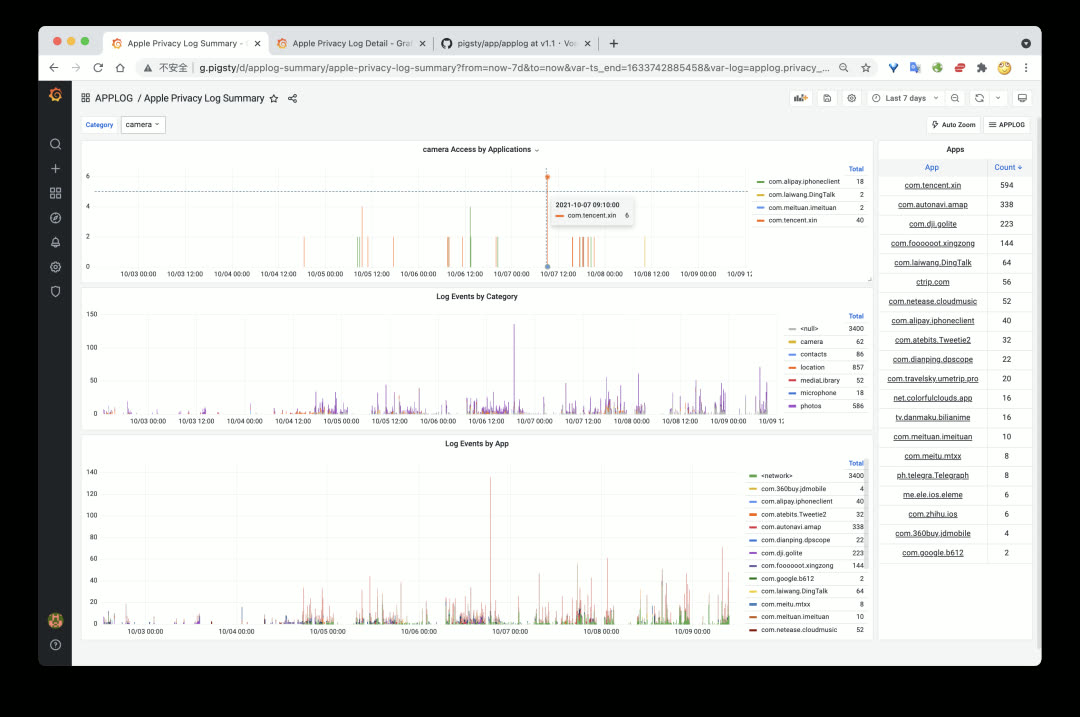
Handy Features
Dummy File Placeholder
v1.1 adds a new feature for database instances: Dummy File. The concept is simple — create a file of a certain size (e.g., 1–4GB) at /pg/dummy. When disk-full failures occur (when many operations can’t complete normally), just delete it to free up emergency space.
Promscale Support
v1.1 adds the Promscale package. This interesting component lets you replace Prometheus’s time-series storage with TimescaleDB (PostgreSQL).
v1.1.0 Release Notes
Feature Enhancements
- Added
pg_dummy_filesizeto create filesystem space placeholder - Major homepage redesign
- Added JupyterLab integration
- Added PGWeb console integration
- Added PgBadger support
- Added PEV2 support, execution plan visualization tool
- Added pglog tooling
Software Upgrades
- PostgreSQL upgraded to v13.4 (with official PG14 support)
- pgbouncer upgraded to v1.16 (metric definitions updated)
- Grafana upgraded to v8.1.4
- Prometheus upgraded to v2.29
- node_exporter upgraded to v1.2.2
- HAProxy upgraded to v2.1.1
- Consul upgraded to v1.10.2
- vip-manager upgraded to v1.0.1
API Changes
nginx_upstreamnow has different structure (incompatible)- New config entry:
app_list, navigation entries rendered to homepage - New config entry:
docs_enabled, setup local docs on default server - New config entry:
pev2_enabled, setup local PEV2 tool - New config entry:
pgbadger_enabled, create log summary/report directory - New config entry:
jupyter_enabled, enable JupyterLab server on meta node - New config entry:
jupyter_username, specify user to run JupyterLab - New config entry:
jupyter_password, specify default password for JupyterLab - New config entry:
pgweb_enabled, enable PGWeb server on meta node - New config entry:
pgweb_username, specify user to run PGWeb - Renamed internal flag
repo_existtorepo_exists repo_addressdefault value changed topigstyinstead ofyum.pigsty- HAProxy access point changed to
http://pigstyinstead ofhttp://h.pigsty
v1.1.1 Release Notes
- Replaced TimescaleDB
apacheversion withtimescaleversion - Upgraded Prometheus to 2.30
- Fixed pg_exporter config directory owner issue (changed to
{{ pg_dbsu }})
Upgrade Notes
The main change in this version is TimescaleDB — using the official TimescaleDB License (TSL) version to replace the Apache License v2 version from the PGDG repository.
2.6 - Pigsty v1.0: GA Release with Monitoring Overhaul
Originally published on VONNG.

After over a year of iterations and refinement, Pigsty officially ships v1.0.0 GA.
Pigsty (/ˈpɪɡˌstaɪ/) stands for PostgreSQL In Graphic STYle — PostgreSQL, visualized.
What is Pigsty?
Pigsty is a batteries-included PostgreSQL distribution that bundles production-grade cluster deployment, scaling, replication, failover, traffic routing, connection pooling, service discovery, access control, monitoring, alerting, and logging into a single cohesive package. It solves the hard problems you’ll face when running PostgreSQL — the world’s most advanced open-source relational database — in production.
| Role | Description |
|---|---|
| Distribution | Batteries-included PostgreSQL distribution |
| Monitoring | Professional-grade PostgreSQL observability |
| Deployment | Simple, HA-ready deployment solution |
| Sandbox | Versatile local sandbox & data visualization environment |
| Open Source | Free as in freedom, Apache 2.0 licensed |
Core Features
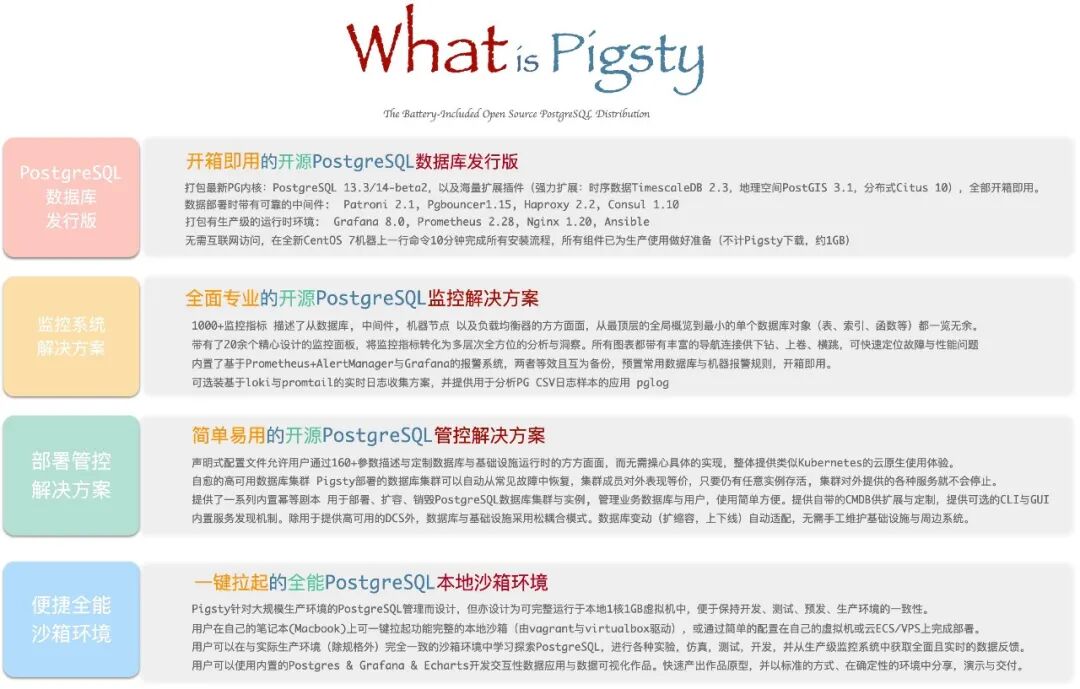
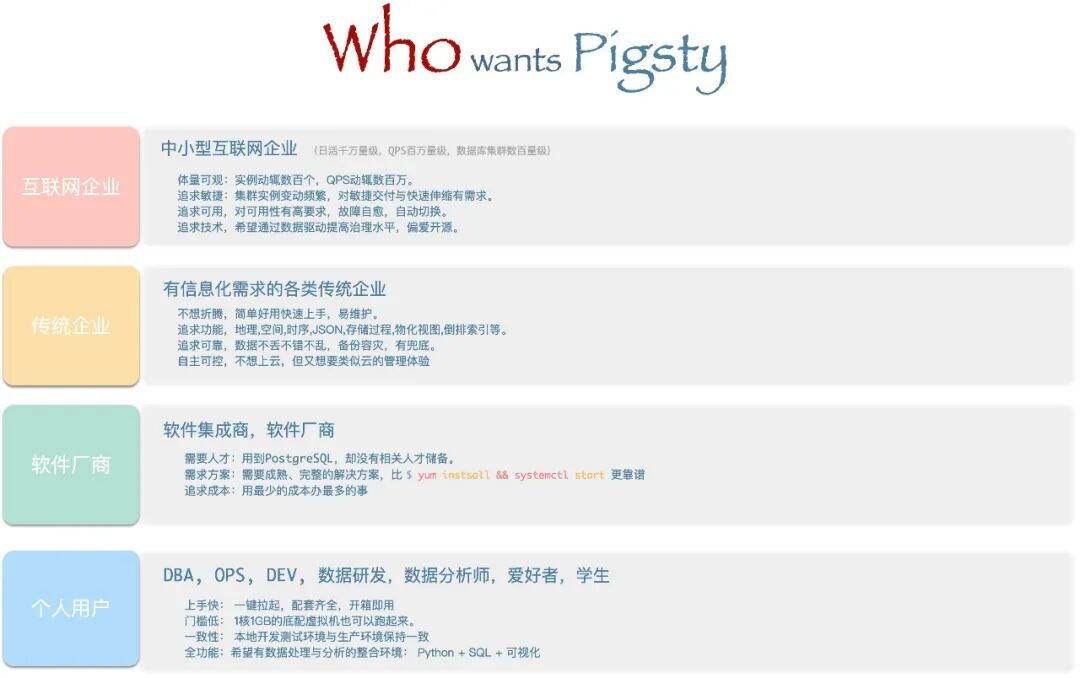
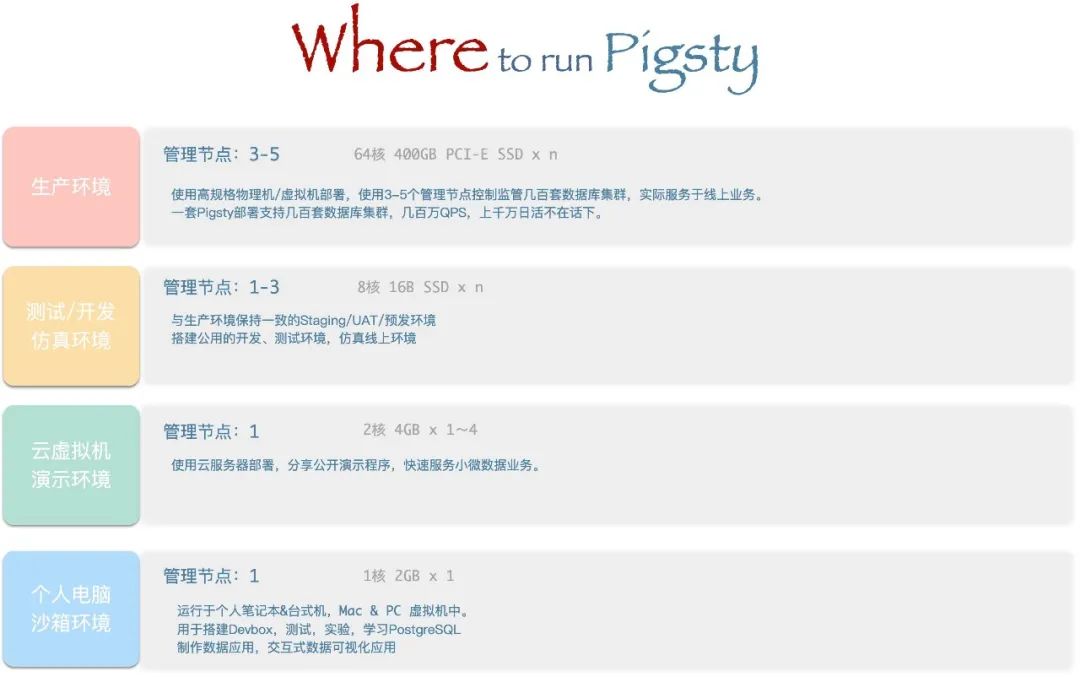
Distribution
A distribution is a complete solution built from a database kernel plus a curated set of software packages. Linux is an OS kernel; RedHat, Debian, and SUSE are distributions built on top of it. PostgreSQL is a database kernel; Pigsty, BigSQL, Percona, and various cloud RDS offerings are distributions built on top of it.
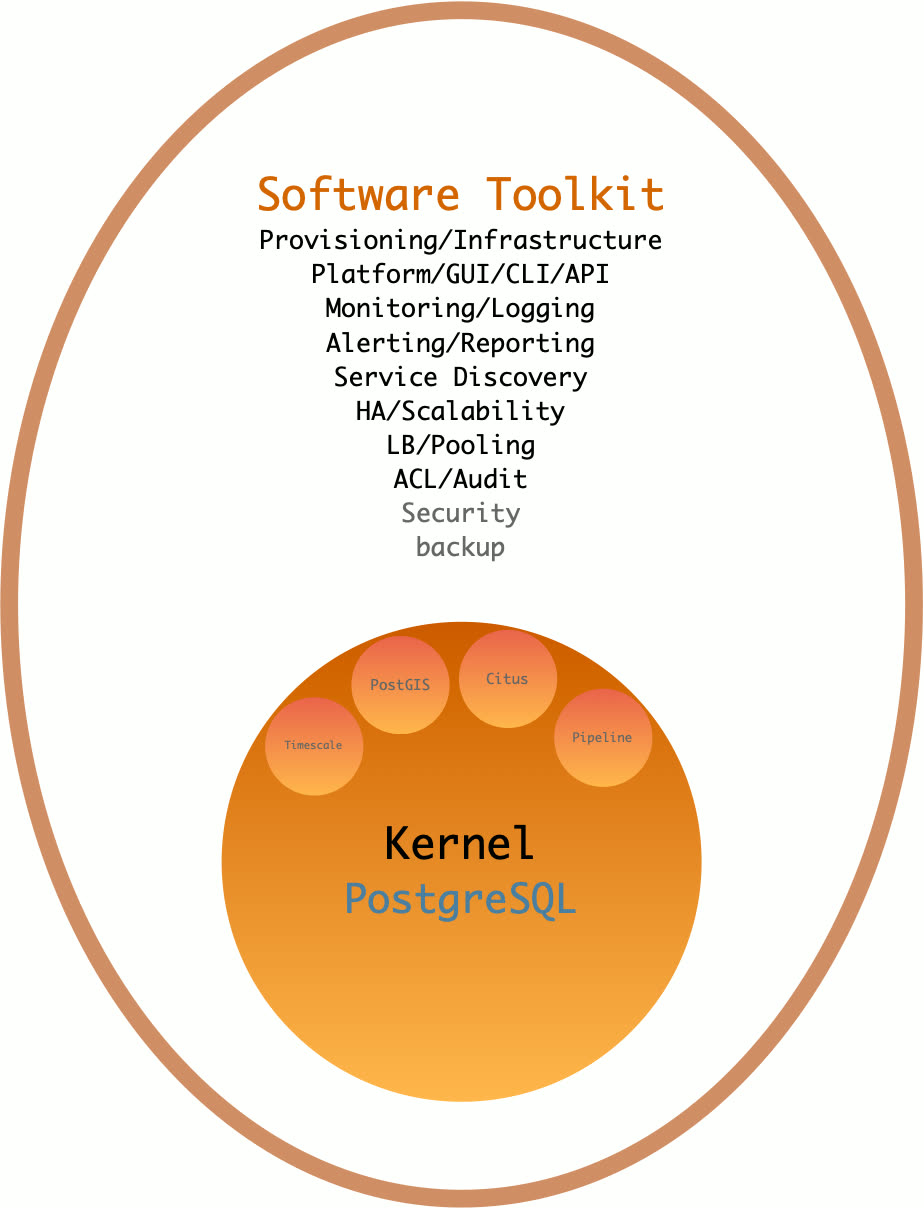
As a database distribution, Pigsty’s core strengths are:
- Comprehensive, professional monitoring system
- Simple, easy-to-use deployment solution
- Stable, reliable high-availability architecture
- Versatile, powerful sandbox environment
- Free, friendly open-source license
Batteries Included
Batteries-included means: start with a fresh VM, run one command, and within 10 minutes you’ll have infrastructure, database, monitoring, and control plane fully operational.
Pigsty pushes deployment and monitoring to the extreme, turning the historically high-barrier work of deploying, managing, and operating large-scale database clusters into something any developer can handle.
For power users, Pigsty provides the most comprehensive monitoring system available. For everyone else, Pigsty provides the simplest deployment experience. For data engineers, Pigsty also integrates tools like JupyterLab and ECharts, making it a complete IDE for data development and visualization.
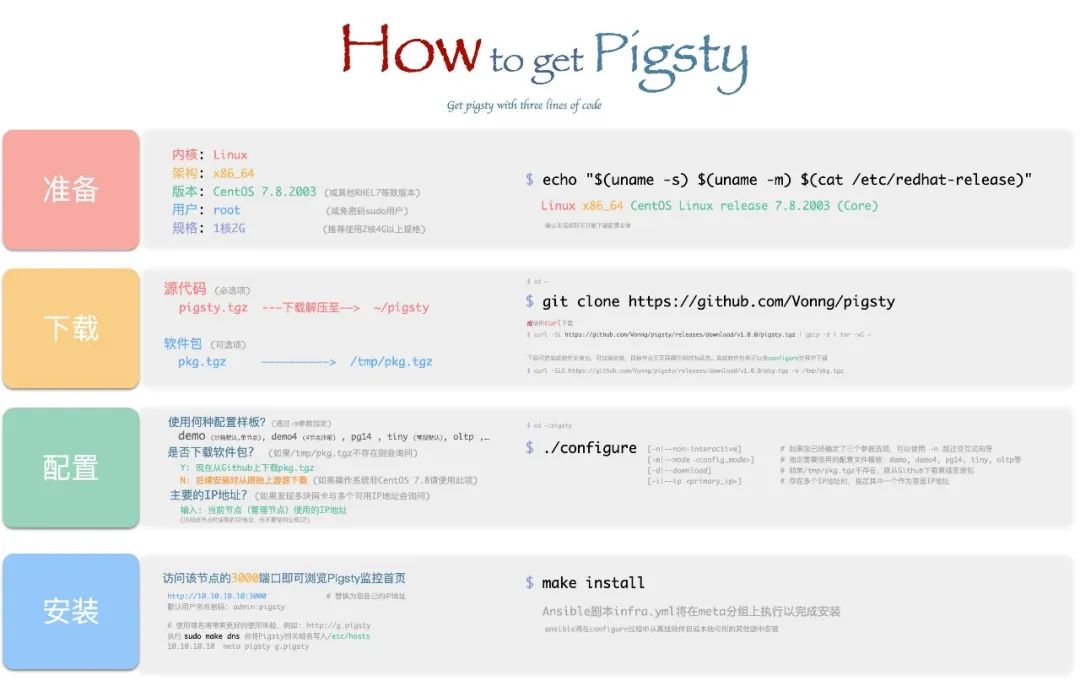
Monitoring System
Pigsty ships with a professional-grade PostgreSQL monitoring system designed for large-scale database fleet management. It includes ~1200 metric types, 20+ dashboards, and thousands of panels, covering everything from fleet-wide overviews down to individual object details. Compared to alternatives, it leads by a wide margin in metric coverage and dashboard richness — delivering irreplaceable value for professionals.
A typical Pigsty deployment can manage hundreds of database clusters, collect thousands of metric types, handle millions of time series, and organize them into thousands of panels across dozens of dashboards in real-time. From global fleet overviews to per-object details (tables, queries, indexes, functions), it’s like having a real-time MRI/CT scanner for your database — everything laid bare.
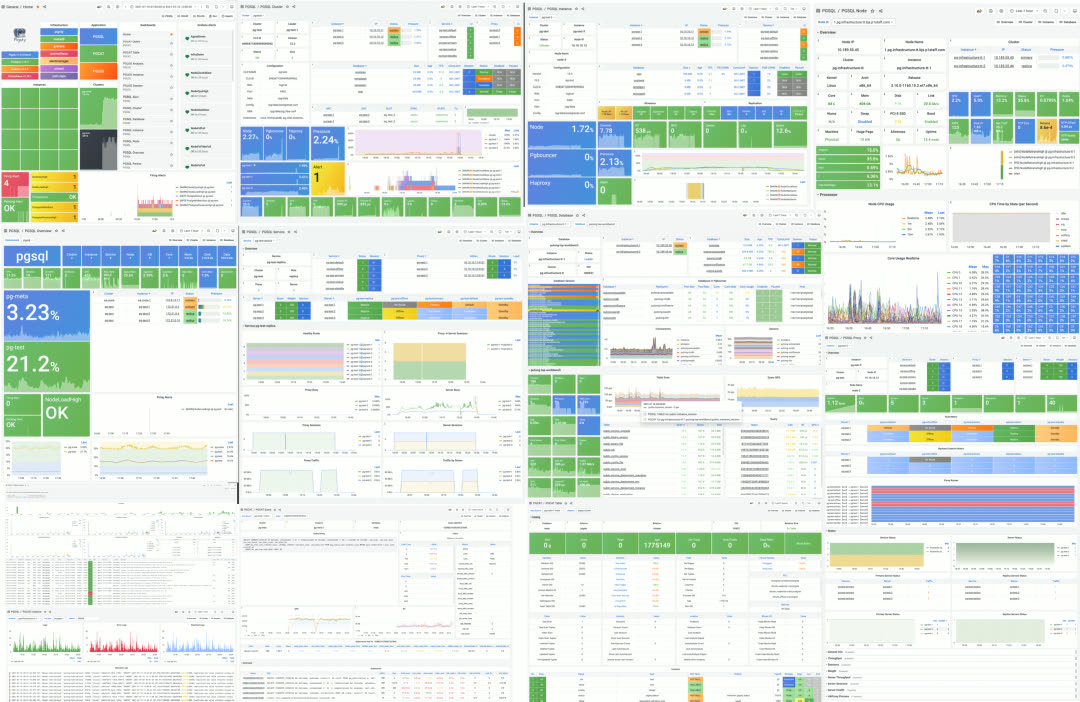
Dashboard gallery
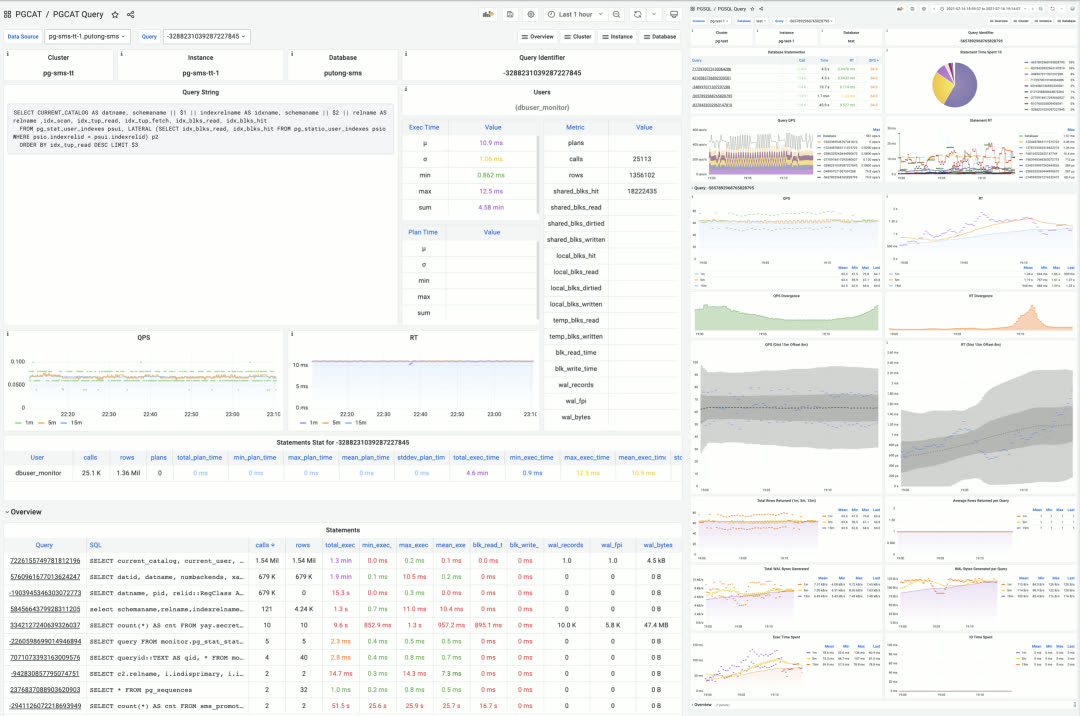
Single query monitoring
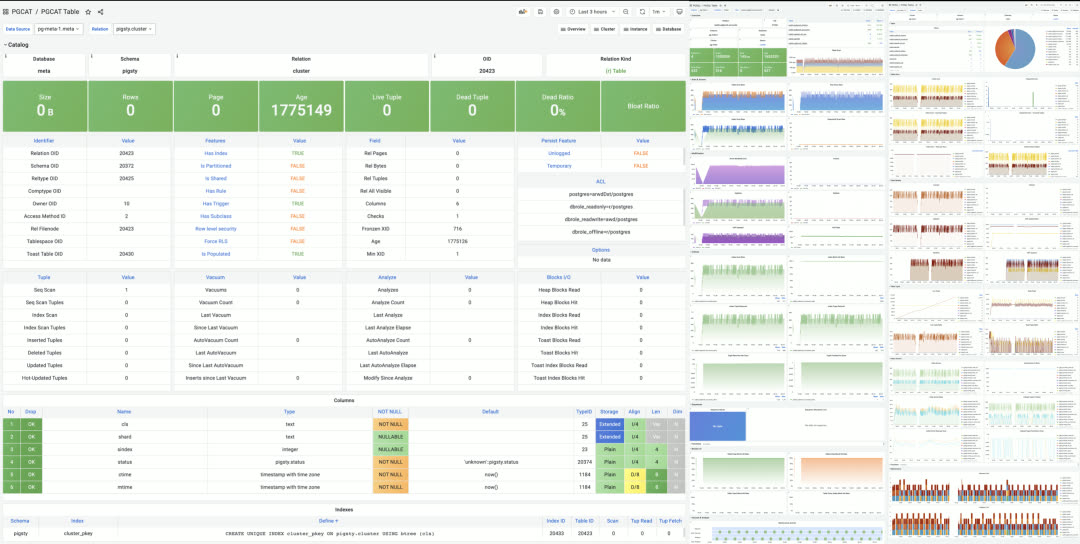
Single table monitoring
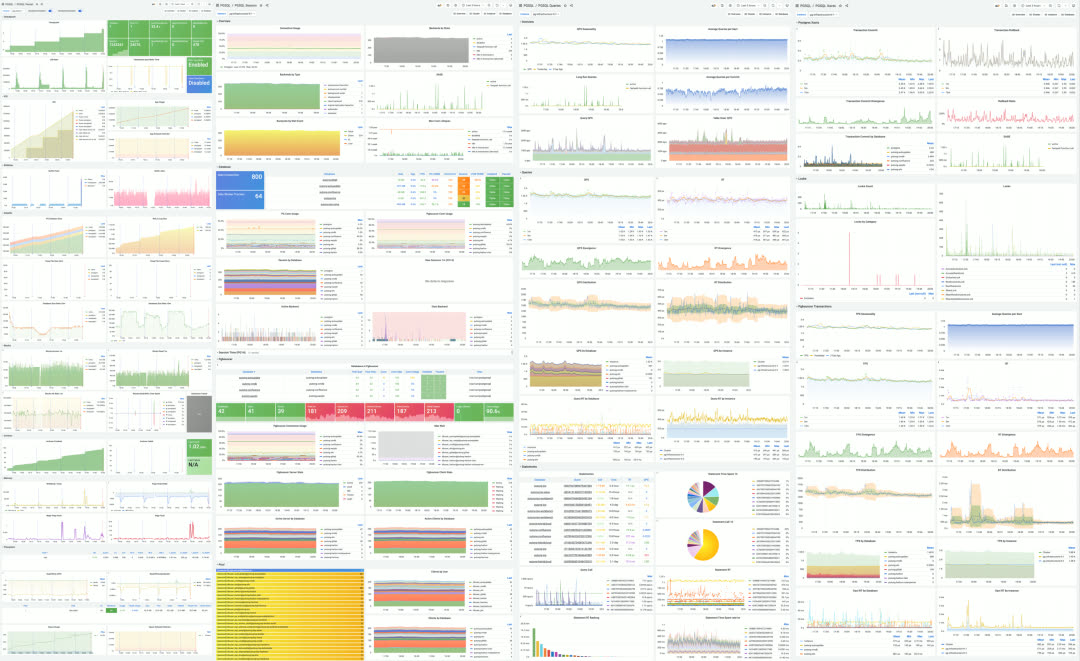
Instance-level monitoring dashboard
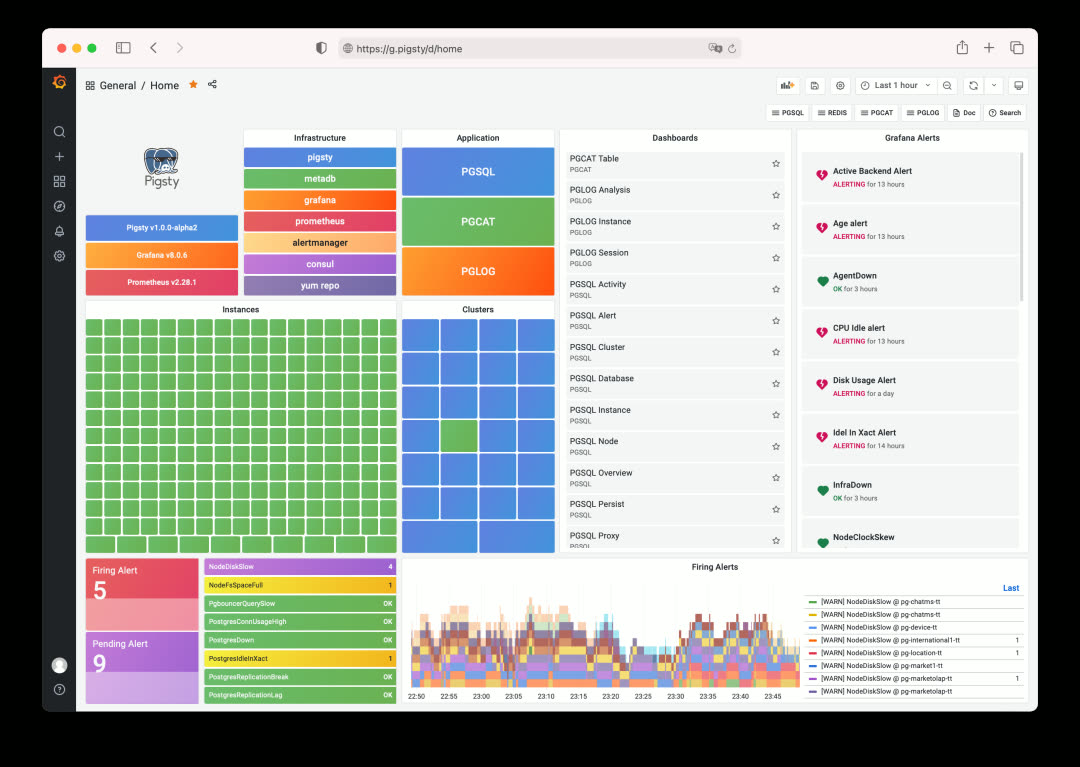
Three Core Applications
Pigsty’s monitoring system is composed of three tightly integrated core applications:
PGSQL — Collect and visualize monitoring metrics
PGCAT — Browse database system catalogs directly
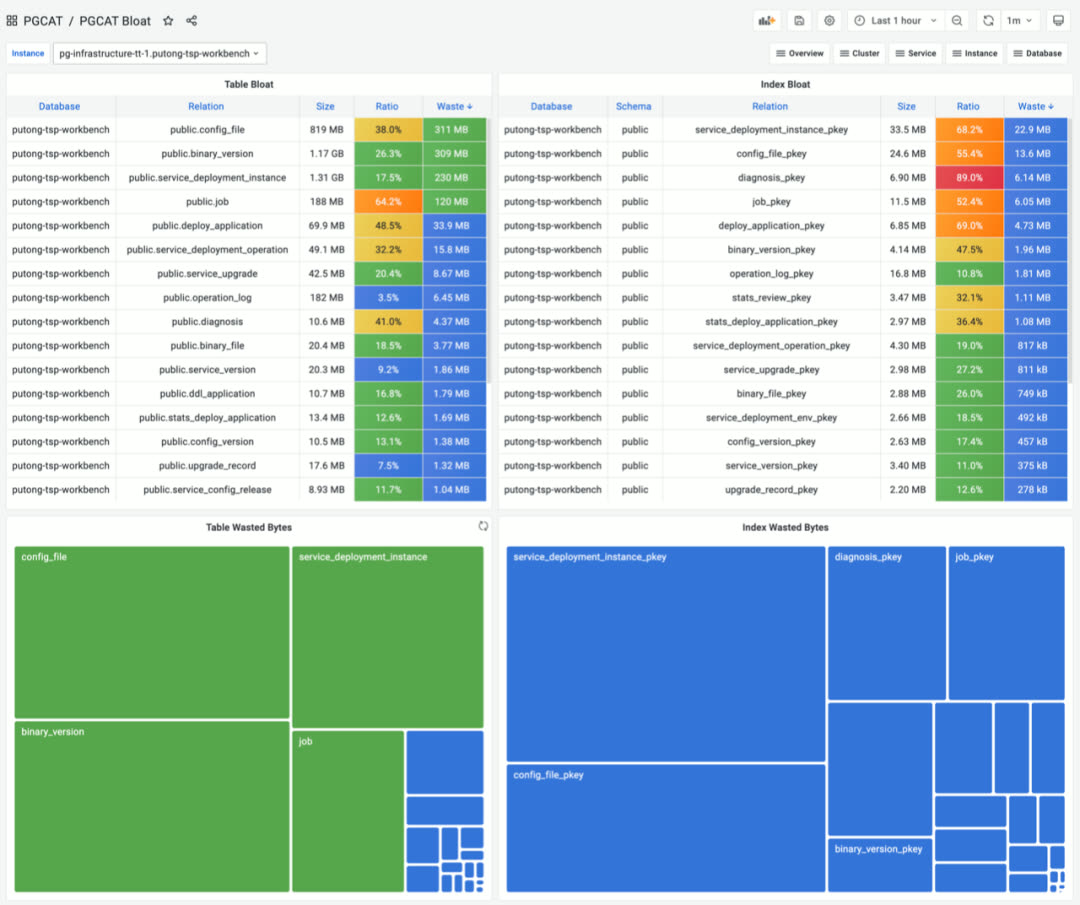
PGLOG — Real-time log search and analysis
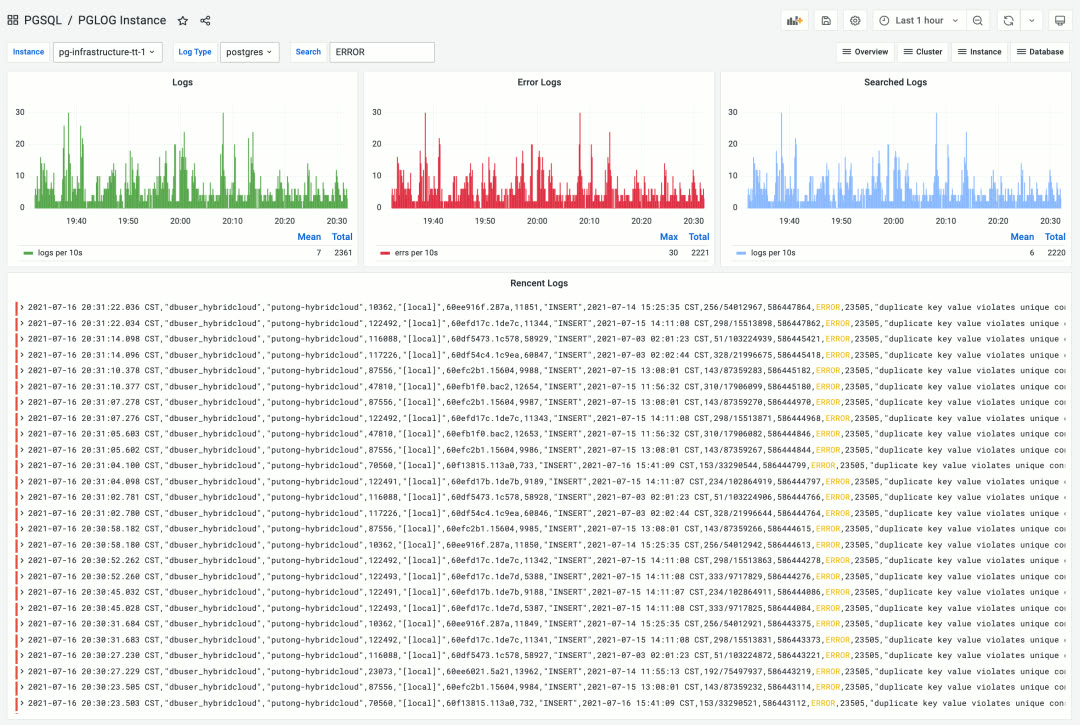
Pigsty’s monitoring system is built on industry best practices, using Prometheus and Grafana as the monitoring infrastructure. Open source, easy to customize, reusable, portable, no vendor lock-in. It can integrate with existing PostgreSQL instances and can also be used to monitor and manage other databases or applications (like Redis).
Deployment Solution
A database is software that manages data. A control plane is software that manages databases.
Pigsty includes an Ansible-based database management solution, with CLI and GUI wrappers on top. It handles core database management functions: cluster creation, destruction, scaling; user, database, and service provisioning.
Pigsty embraces the Infrastructure as Code philosophy, using Kubernetes-style declarative configuration. Describe your database and runtime environment through extensive config options, and idempotent playbooks automatically create the clusters you need — delivering a private-cloud-like experience.
Users simply describe “what kind of database they want” via config files or GUI — no need to worry about how Pigsty creates or modifies it. Pigsty will spin up the desired database cluster from bare metal nodes within minutes.
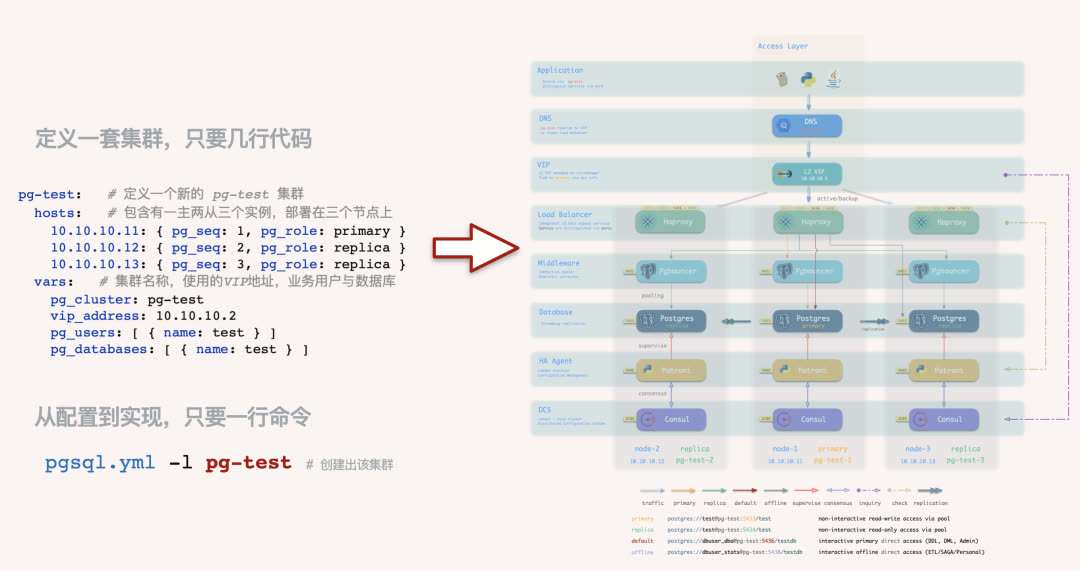
For users who prefer not to work with config files and Ansible playbooks, Pigsty also offers optional CMDB mode and CLI/GUI tools wrapping common operations.
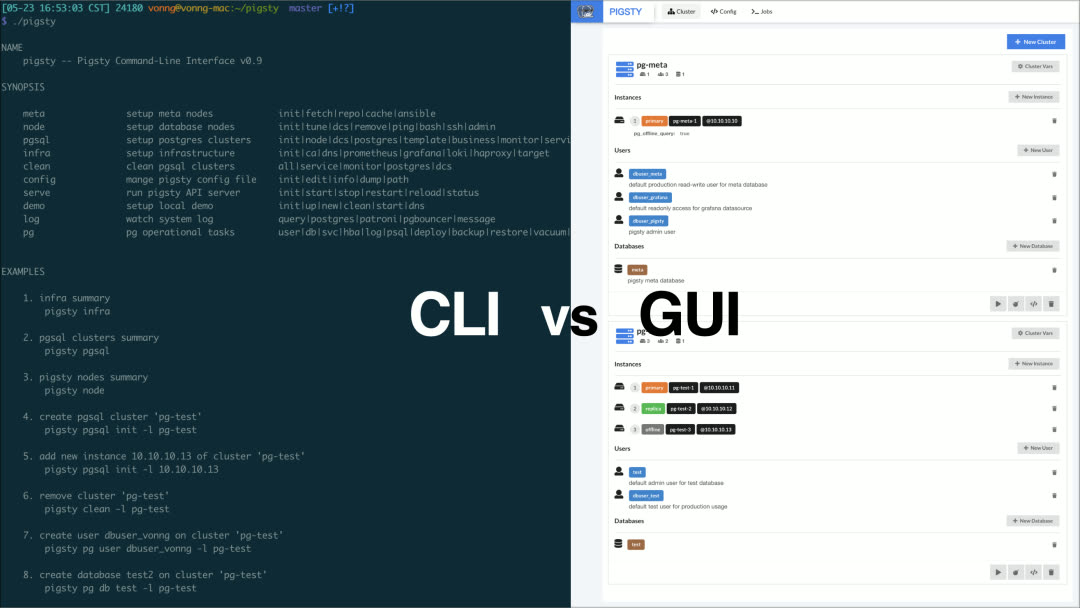
For power users, Pigsty provides 160+ configurable parameters, allowing fine-grained control over every aspect of cluster and infrastructure runtime. Beginners can create reliable database clusters without changing a single config setting.
High Availability Clusters
Pigsty creates distributed, highly-available database clusters. In practice, as long as any instance in the cluster survives, the cluster can provide full read-write and read-only services.
Every database instance in the cluster is functionally equivalent — any instance can serve full read-write traffic through the built-in load balancer. Clusters automatically detect failures and perform primary-replica failover; typical failures self-heal in seconds to tens of seconds, with read-only traffic unaffected during the process.
Pigsty’s HA architecture is battle-tested in production, achieving complete high availability with minimal complexity — making traditional primary-replica databases feel like distributed databases.
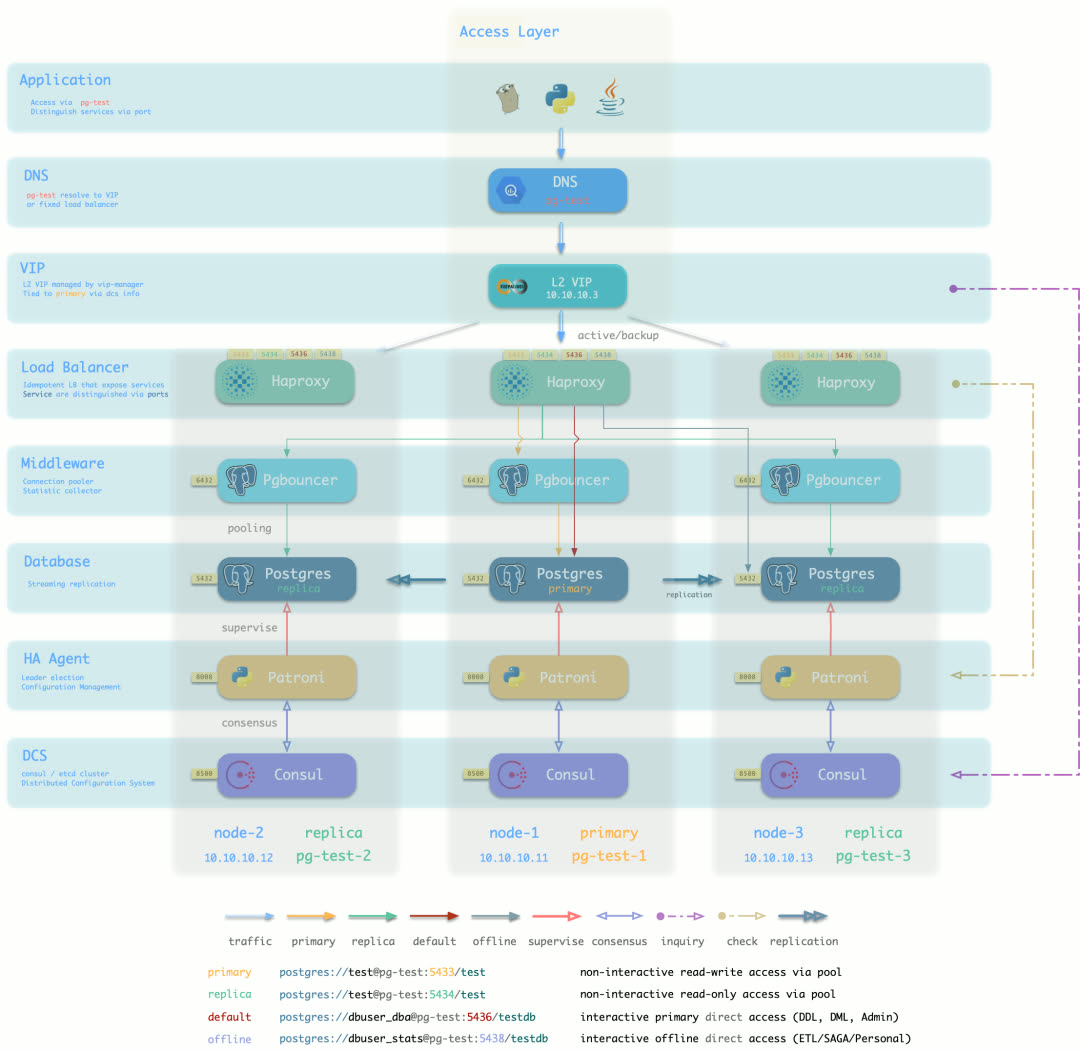
Default access topology (DNS + L2 VIP + HAProxy, 7 options total)
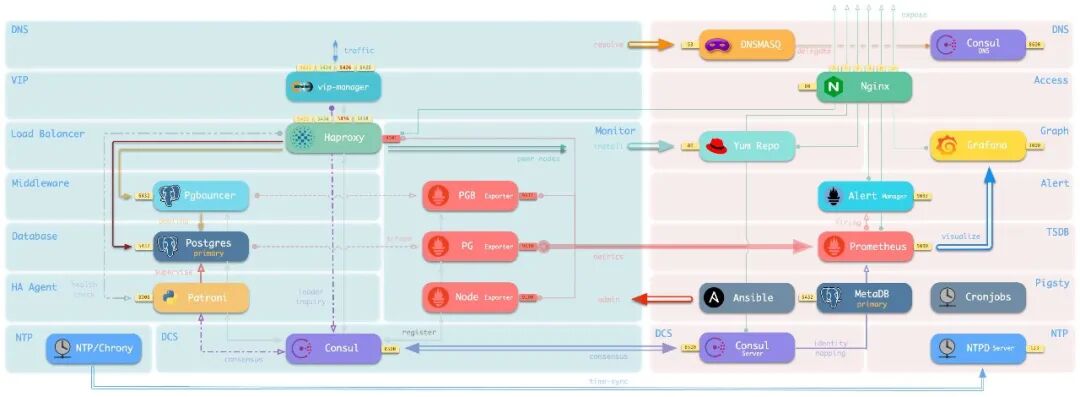
Sandbox Environment
PostgreSQL users aren’t just enterprises — countless individuals use it for software development, testing, experiments, demos, or for data cleaning, analysis, visualization, and storage. Setting up the environment is often the first hurdle.
The Pigsty sandbox solves this problem. With one click, spin up a complete production-grade PostgreSQL service on your laptop or PC (Vagrant calls VirtualBox to automatically create the VMs). The default sandbox is single-node (2c/4g) with all essential tools, suitable for various use cases. There’s also a four-node full sandbox for production-like environments, fully exploring Pigsty’s HA architecture and monitoring capabilities.
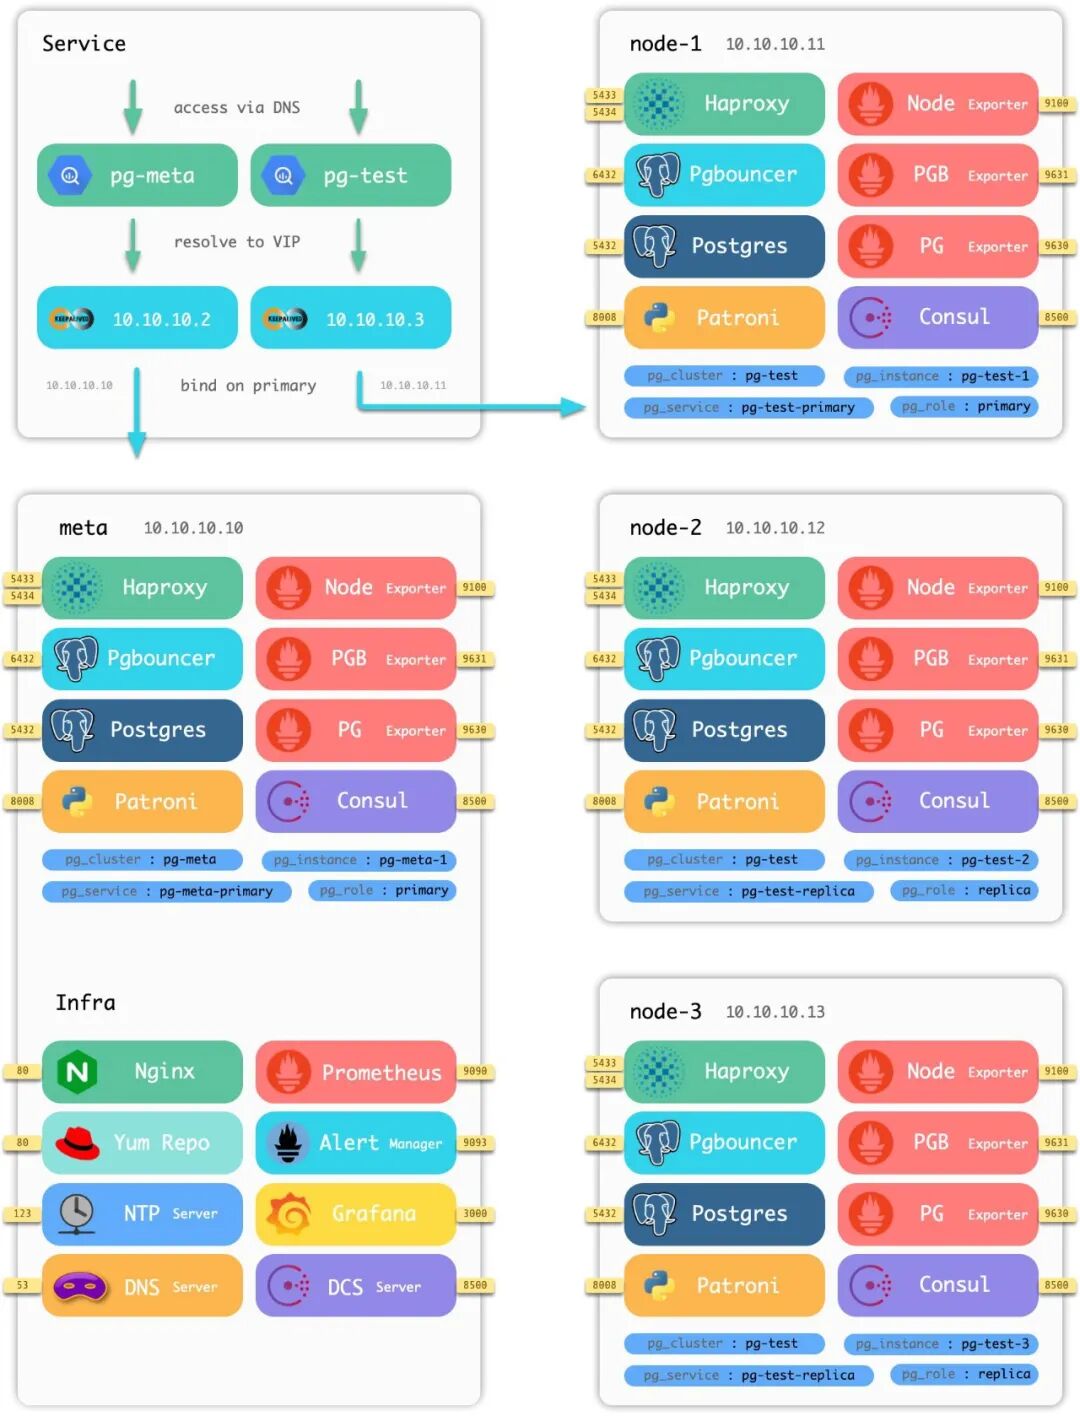
Four-node sandbox architecture diagram
Data Analysis
Pigsty provides PostgreSQL as the backend database, JupyterLab as the Python IDE, Grafana as the frontend/backend runtime, and the Grafana ECharts Panel for advanced visualization. Together, these tools form a complete toolkit for data processing, analysis, and data application development.
Build your data analysis workflow on Pigsty, rapidly prototype data application POCs, and package/distribute/deploy them in a standardized way. Pigsty ships with two sample data applications:
COVID — Pandemic data visualization app
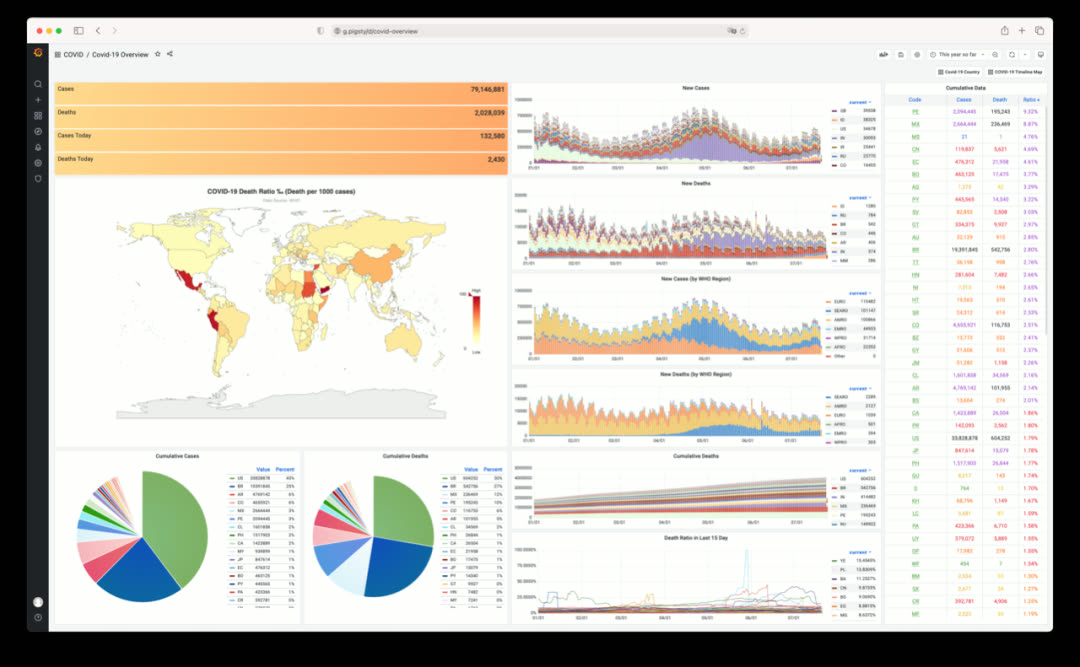
Click to view individual country details and timeline maps
ISD — Global surface weather station historical data explorer
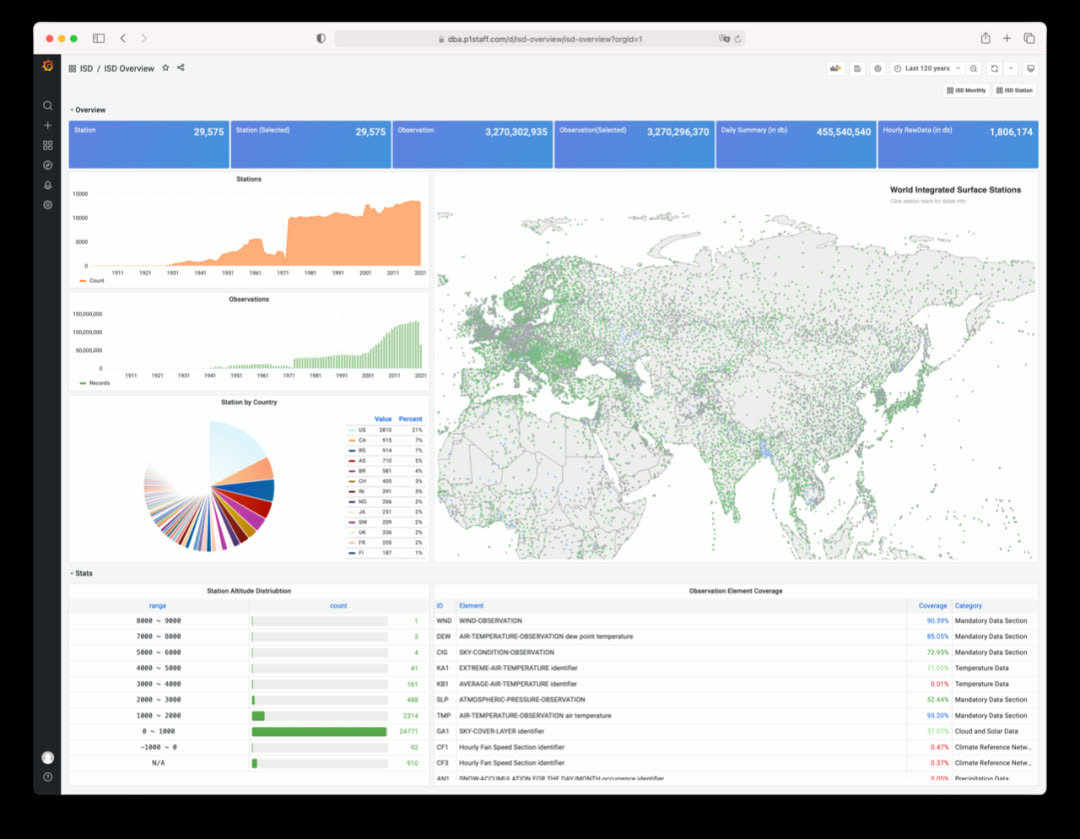
Click to view individual station details and historical weather data
Roadmap
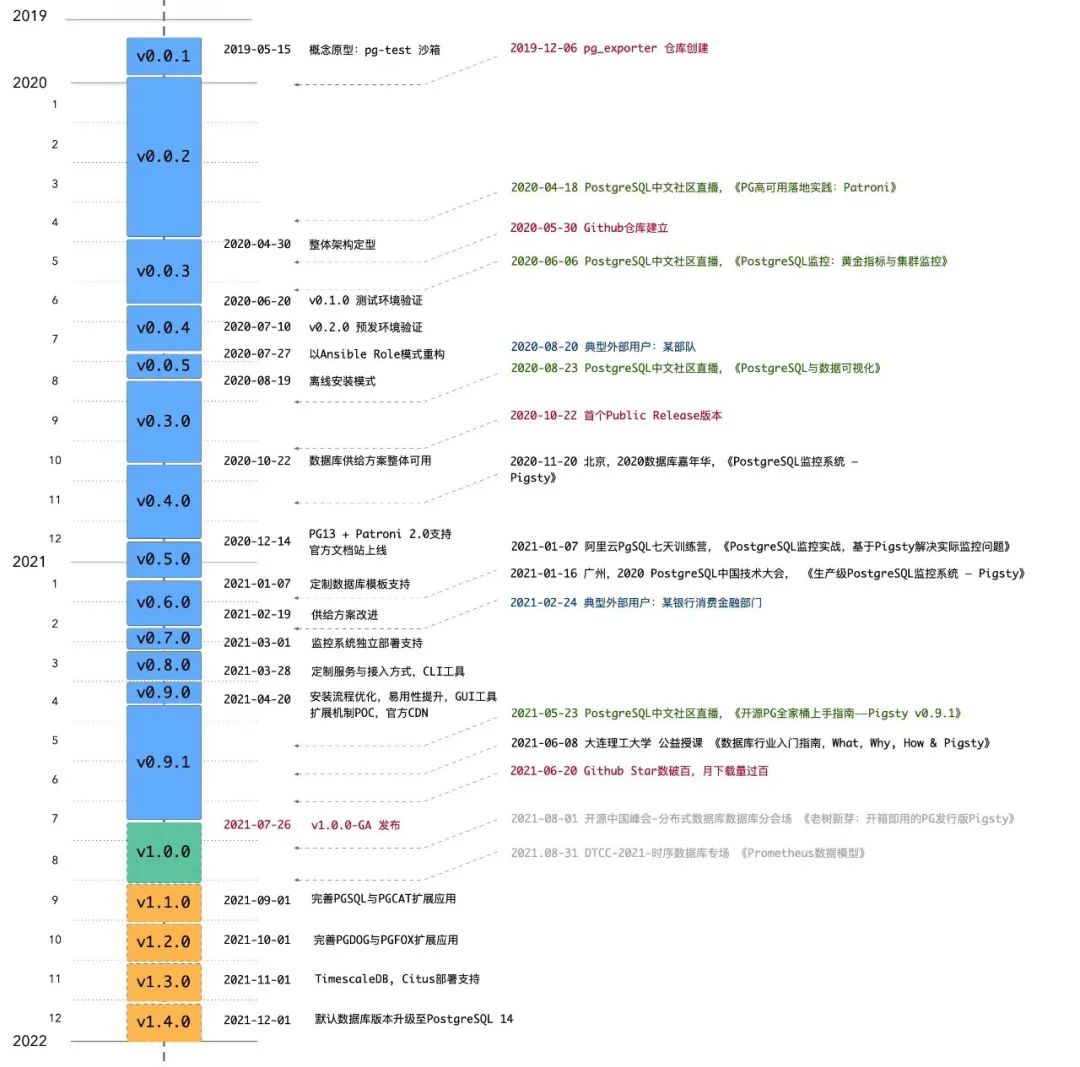
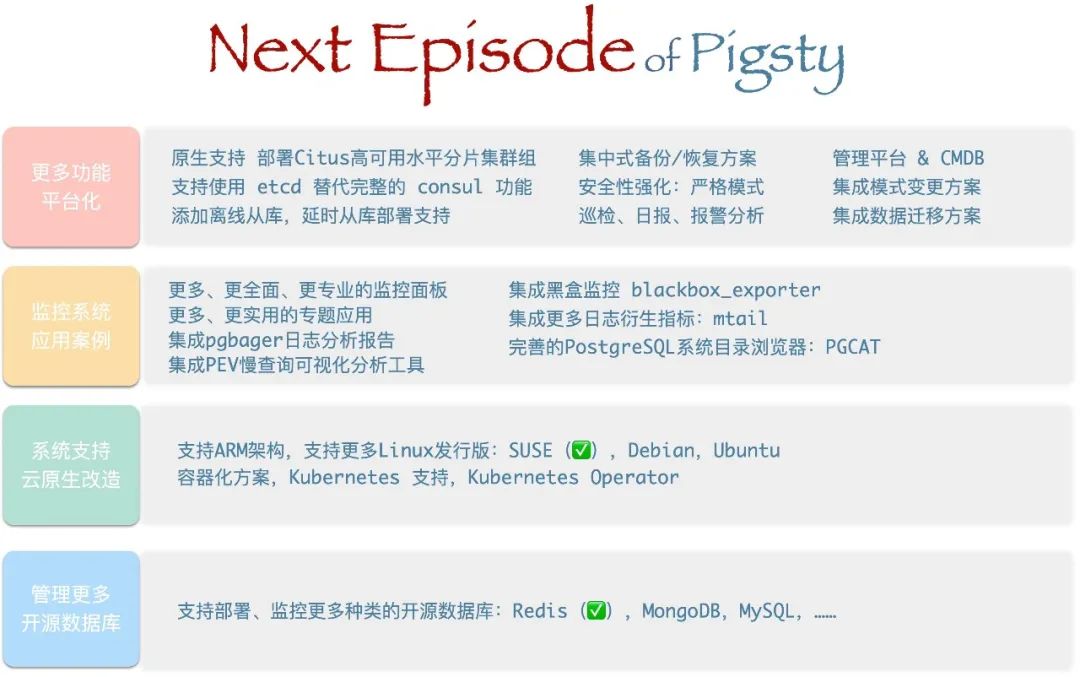
Open Source
Pigsty is open-source under the Apache 2.0 license — free for commercial use, with modifications and derivatives subject to Apache License 2.0’s attribution requirements.
Pigsty’s mission: Use databases well, use good databases.
Give SMBs a truly self-controlled choice, and let everyone enjoy the power of PostgreSQL.
v1.0.0 Release Notes
Monitoring System Overhaul
- New dashboards on Grafana 8.0
- New metric definitions, added PG14 support
- Simplified labeling system: static label set (job, cls, ins)
- New alerting rules and derived metrics
- Monitor multiple databases simultaneously
- Real-time log search & csvlog analysis
- Richly-linked dashboards, click through for drill-down/roll-up
Architecture Changes
- Added Citus and TimescaleDB to default installation
- Added PostgreSQL 14beta2 support
- Simplified HAProxy admin page indexing
- Decoupled infrastructure and PGSQL by adding new role
register - Added new roles
lokiandpromtailfor logging - Added new role
environto setup environment for admin user on meta node - Default to
staticservice discovery for Prometheus (instead ofconsul) - Added new role
removefor graceful cluster and instance removal - Upgraded Prometheus and Grafana provisioning logic
- Upgraded to vip-manager 1.0, node_exporter 1.2, pg_exporter 0.4, Grafana 8.0
- Every database on every instance auto-registers as a Grafana datasource
- Moved Consul registration to
registerrole, changed Consul service tags - Added cmdb.sql as pg-meta baseline definition (CMDB & PGLOG)
Application Framework
- Extensible framework for new features
- Core app: PostgreSQL monitoring system
pgsql - Core app: PostgreSQL catalog explorer
pgcat - Core app: PostgreSQL csvlog analyzer
pglog - Added sample app
covidfor COVID-19 data visualization - Added sample app
isdfor ISD weather data visualization
Other
- Added JupyterLab for full Python data science environment
- Added
vonng-echarts-panelto restore ECharts support - Added wrapper scripts
createpg,createdb,createuser - Added CMDB dynamic inventory scripts:
load_conf.py,inventory_cmdb,inventory_conf - Removed obsolete playbooks:
pgsql-monitor,pgsql-service,node-remove, etc.
API Changes
- New variable:
node_meta_pip_install - New variable:
grafana_admin_username - New variable:
grafana_database - New variable:
grafana_pgurl - New variable:
pg_shared_libraries - New variable:
pg_exporter_auto_discovery - New variable:
pg_exporter_exclude_database - New variable:
pg_exporter_include_database - Variable renamed:
grafana_url→grafana_endpoint
Bug Fixes
- Fixed default timezone Asia/Shanghai (CST) issue
- Fixed nofile limits for pgbouncer & patroni
- pgbouncer user list and database list now generated when running tag
pgbouncer
v1.0.1 Release Notes
2021-09-14
Documentation Update
- Chinese documentation now available
- Machine-translated English documentation now available
Bug Fixes
pgsql-removeno longer removes primary instances- Replaced pg_instance with pg_cluster + pg_seq (Start-At-Task could fail when pg_instance undefined)
- Removed Citus from default shared preload libraries (Citus forces max_prepared_transaction to non-zero)
- Added ssh sudo check in
configure(now usesssh -t sudo -n lsfor permission check) - Fixed
pg-backupscript typo
Optimizations
- Removed NTP sanity check alert (duplicate of ClockSkew)
- Removed collector.systemd to reduce overhead
2.7 - Ready-to-Use PostgreSQL Distribution: Pigsty
Originally published on VONNG.
What is Pigsty
Pigsty is a ready-to-use production-grade open-source PostgreSQL distribution.

A distribution refers to a complete database solution consisting of a database kernel and its suite of software packages. For example, Linux is an operating system kernel, while RedHat, Debian, and SUSE are operating system distributions based on this kernel. PostgreSQL is a database kernel, while Pigsty, BigSQL, Percona, various cloud RDS services, and rebranded databases are database distributions based on this kernel.
Pigsty differs from other database distributions with five core features:
- Comprehensive and professional monitoring system
- Stable and reliable deployment solution
- Simple and worry-free user interface
- Flexible and open extension mechanism
- Free and friendly open-source license
These five characteristics make Pigsty truly a ready-to-use PostgreSQL distribution.
Who Would Be Interested?
Pigsty’s target user groups include: DBAs, architects, OPS personnel, software vendors, cloud vendors, business developers, kernel developers, data developers; people interested in data analysis and data visualization; students, novice programmers, and users interested in trying databases.
For professional users like DBAs and architects, Pigsty provides a unique professional-grade PostgreSQL monitoring system, offering irreplaceable value for database management. Additionally, Pigsty comes with a stable and reliable, battle-tested production-grade PostgreSQL deployment solution that can automatically deploy PostgreSQL database clusters with monitoring and alerting, log collection, service discovery, connection pooling, load balancing, VIP, and high availability in production environments.
For developers (business developers, kernel developers, data developers), students, novice programmers, and users interested in trying databases, Pigsty provides an extremely low-barrier, one-click startup, one-click installation local sandbox. The local sandbox is identical to production environments except for machine specifications, including complete functionality: ready-to-use database instances and monitoring systems. It can be used for learning, development, testing, data analysis, and other scenarios.
Additionally, Pigsty provides a flexible extension mechanism called “Datalet.” People interested in data analysis and data visualization might be surprised to find that Pigsty can also serve as an integrated development environment for data analysis and visualization. Pigsty integrates PostgreSQL with common data analysis plugins and comes with Grafana and embedded Echarts support, allowing users to write, test, and distribute data mini-applications (Datalets). Such as: “Additional extension panel packages for Pigsty monitoring system,” “Redis monitoring system,” “PG log analysis system,” “application monitoring,” “data directory browser,” etc.
Finally, Pigsty adopts the free and friendly Apache License 2.0, which can be used commercially for free. As long as you comply with Apache 2 License’s attribution clauses, cloud vendors and software vendors are welcome to integrate and commercially develop secondary products.
Comprehensive Professional Monitoring System
You can’t manage what you don’t measure.
— Peter F.Drucker
Pigsty provides a professional-grade monitoring system, offering irreplaceable value to professional users.
Using medical equipment as an analogy, ordinary monitoring systems are like heart rate monitors and pulse oximeters that ordinary people can use without training. They can provide core vital sign indicators for patients: at least users can know if someone is about to die, but they’re powerless for diagnosis and treatment. For example, monitoring systems provided by various cloud and software vendors generally fall into this category: a dozen core indicators that tell you whether the database is still alive, giving people a rough idea, and that’s all.
Professional-grade monitoring systems are like CT scanners and MRI machines that can detect all internal details of objects. Professional physicians can quickly locate diseases and hidden dangers based on CT/MRI reports: treat diseases when present, maintain health when absent. Pigsty can deeply examine every table, every index, every query in every database, providing comprehensive metrics (1155 types) and converting them into insights through thousands of dashboards: nipping failures in the bud and providing real-time feedback for performance optimization.
Pigsty’s monitoring system is based on industry best practices, using Prometheus and Grafana as monitoring infrastructure. It’s open-source, highly customizable, reusable, portable, with no vendor lock-in. It can integrate with various existing database instances.
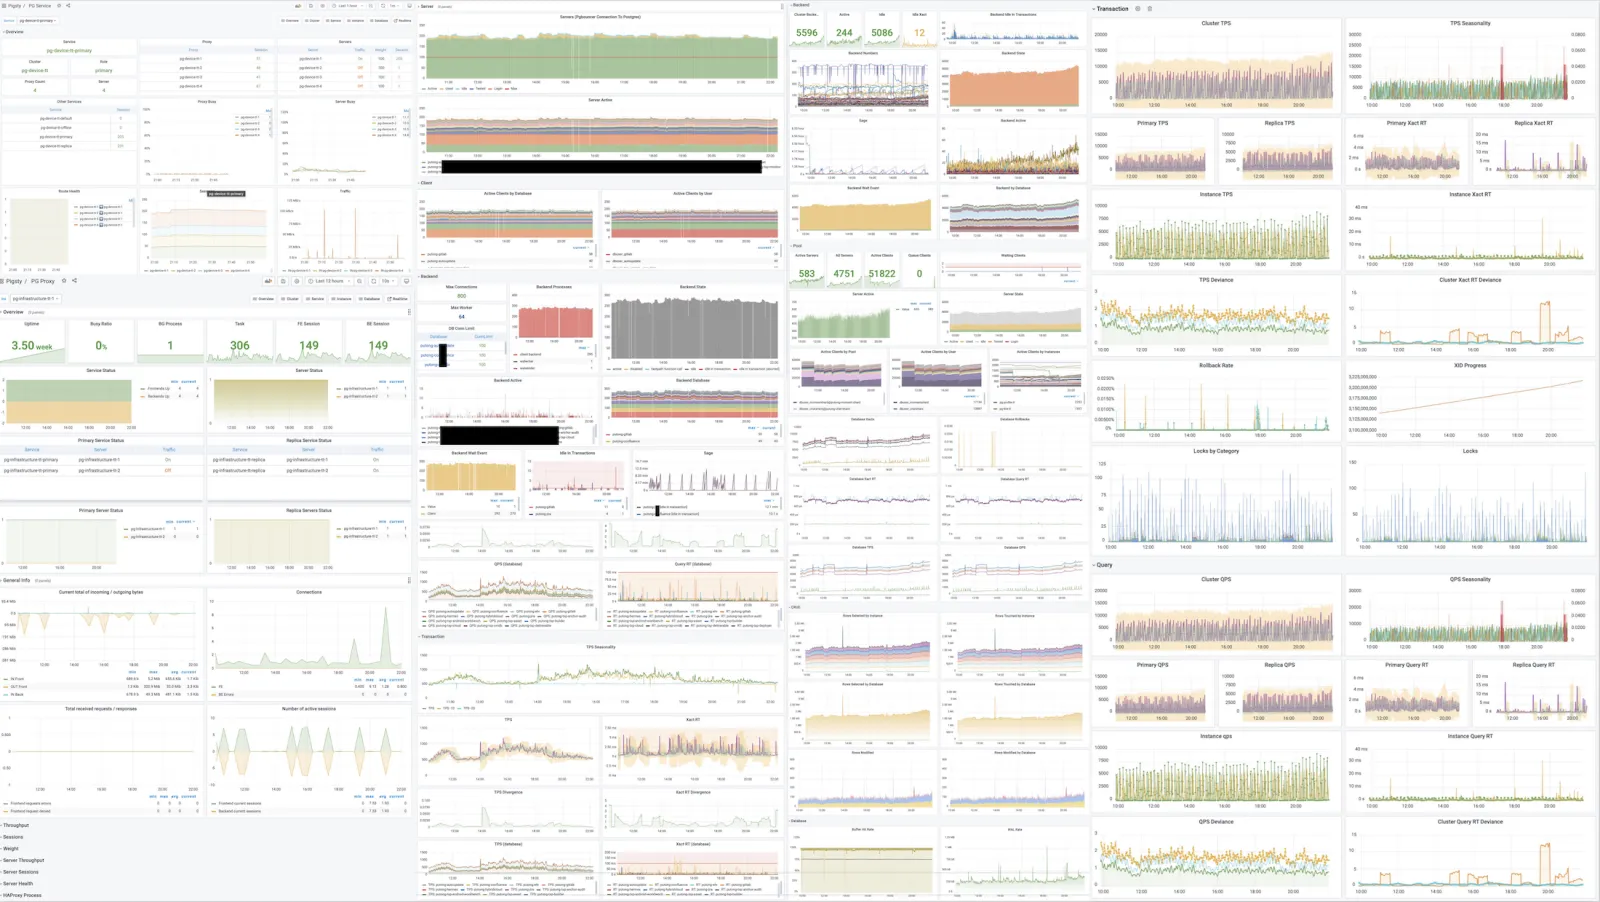
Stable Reliable Deployment Solution

A complex system that works is invariably found to have evolved from a simple system that works.
—John Gall, Systemantics (1975)
Databases are software for managing data; management systems are software for managing databases.
Pigsty has a built-in database management solution centered on Ansible. Based on this, it encapsulates command-line tools and graphical interfaces. It integrates core functions in database management: including database cluster creation, destruction, scaling; user, database, and service creation, etc. Pigsty adopts the “Infra as Code” design philosophy, using declarative configuration to describe and customize databases and runtime environments through numerous optional configuration options, and automatically creates required database clusters through idempotent preset playbooks, providing a near-private-cloud user experience.
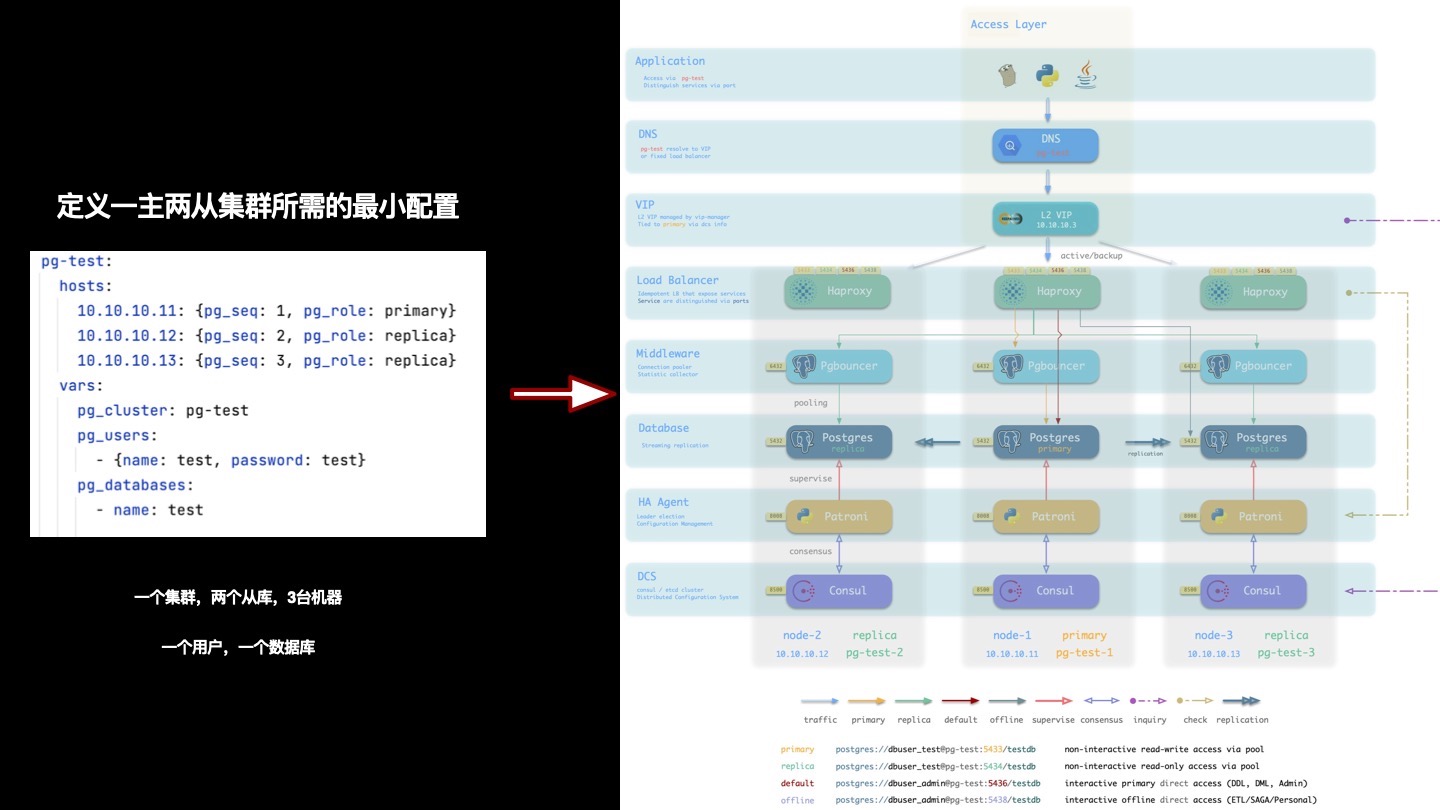
Database clusters created by Pigsty are distributed and highly available. Pigsty-created databases achieve high availability based on DCS, Patroni, and Haproxy. Each database instance in a database cluster is idempotent in usage - any instance can provide complete read-write services through built-in load balancing components, offering a distributed database user experience. Database clusters can automatically perform failure detection and master-slave switching. Ordinary failures can self-heal in seconds to tens of seconds, with read-only traffic unaffected during this period. During failures, as long as any instance in the cluster survives, it can provide complete services externally.
Pigsty’s architectural solution has been carefully designed and evaluated, focusing on achieving required functionality with minimal complexity. This solution has been validated in production environments for long periods and large scales, and has been adopted by organizations in multiple industries including internet/B/G/M/F.
Simple Worry-Free User Interface

Pigsty aims to lower PostgreSQL’s usage barrier, so extensive work has been done on usability.
Installation Deployment
Someone told me that each equation I included in the book would halve the sales.
— Stephen Hawking
Pigsty deployment consists of three steps: download source code, configure environment, execute installation, all can be completed with one command. It follows the classic software installation pattern and provides a configuration wizard. All you need to prepare is a CentOS7.8 machine and root privileges. When managing new nodes, Pigsty uses Ansible to initiate management via ssh without requiring agent installation, making it easy even for novices to complete deployment.
Pigsty can manage hundreds of high-spec production nodes in production environments, and can also run independently on local 1-core 1GB virtual machines as ready-to-use database instances. When used on local computers, Pigsty provides a sandbox based on Vagrant and Virtualbox. It can spin up database environments identical to production with one command, for learning, development, testing, data analysis, data visualization, and other scenarios.
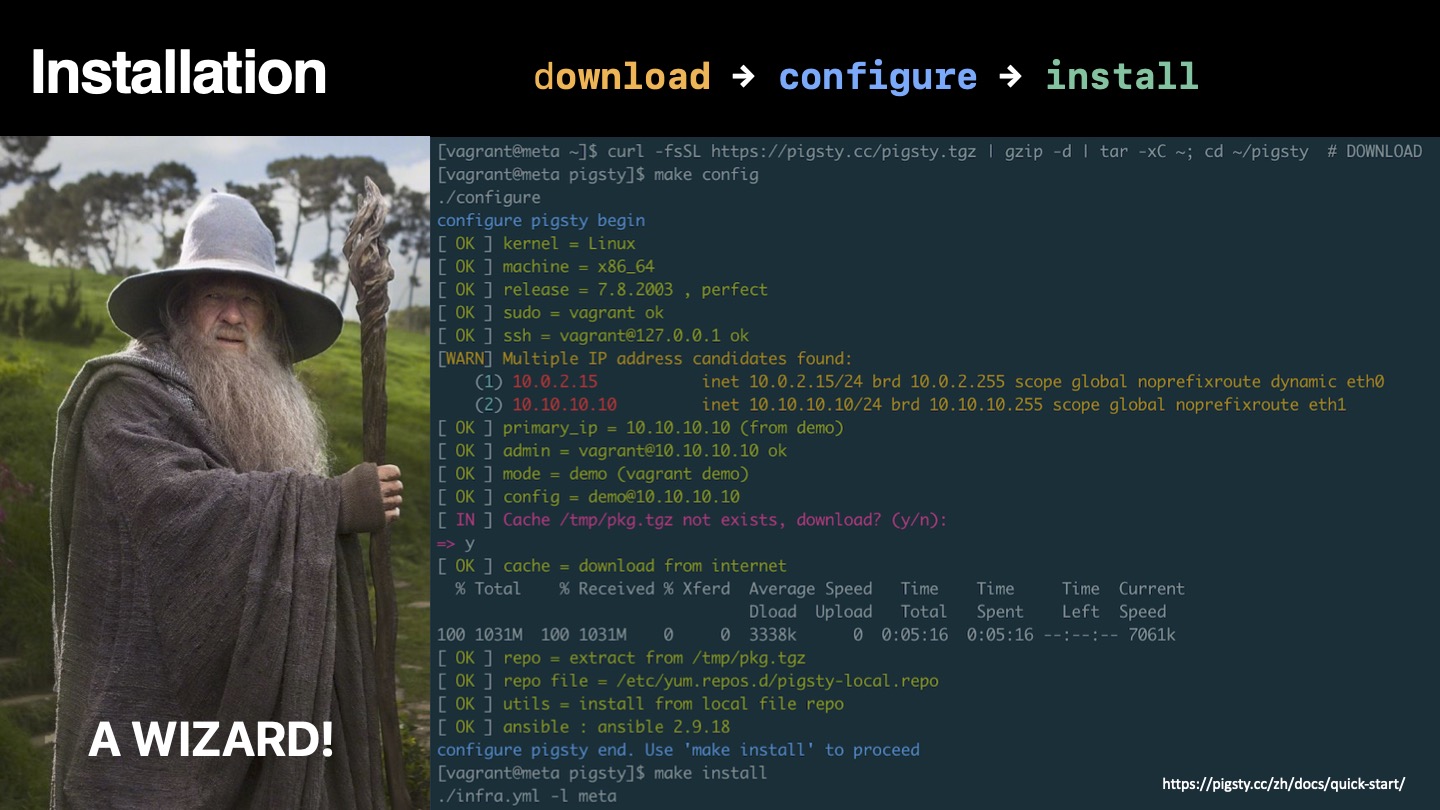
User Interface
Clearly, we must break away from the sequential and not limit the computers. We must state definitions and provide for priorities and descriptions of data. We must state relation‐ ships, not procedures.
—Grace Murray Hopper, Management and the Computer of the Future (1962)
Pigsty incorporates the essence of Kubernetes architectural design, adopting declarative configuration and idempotent operation playbooks. Users only need to describe “what kind of database they want” without caring how Pigsty creates or modifies it. Pigsty will create the required database cluster from bare metal nodes in minutes according to user configuration file manifests.
For management and usage, Pigsty provides different levels of user interfaces to meet different user needs. Novice users can use one-click local sandboxes and graphical user interfaces, while developers can choose to use pigsty-cli command-line tools and configuration files for management. Experienced DBAs, operations staff, and architects can directly use Ansible primitives for fine control over executed tasks.
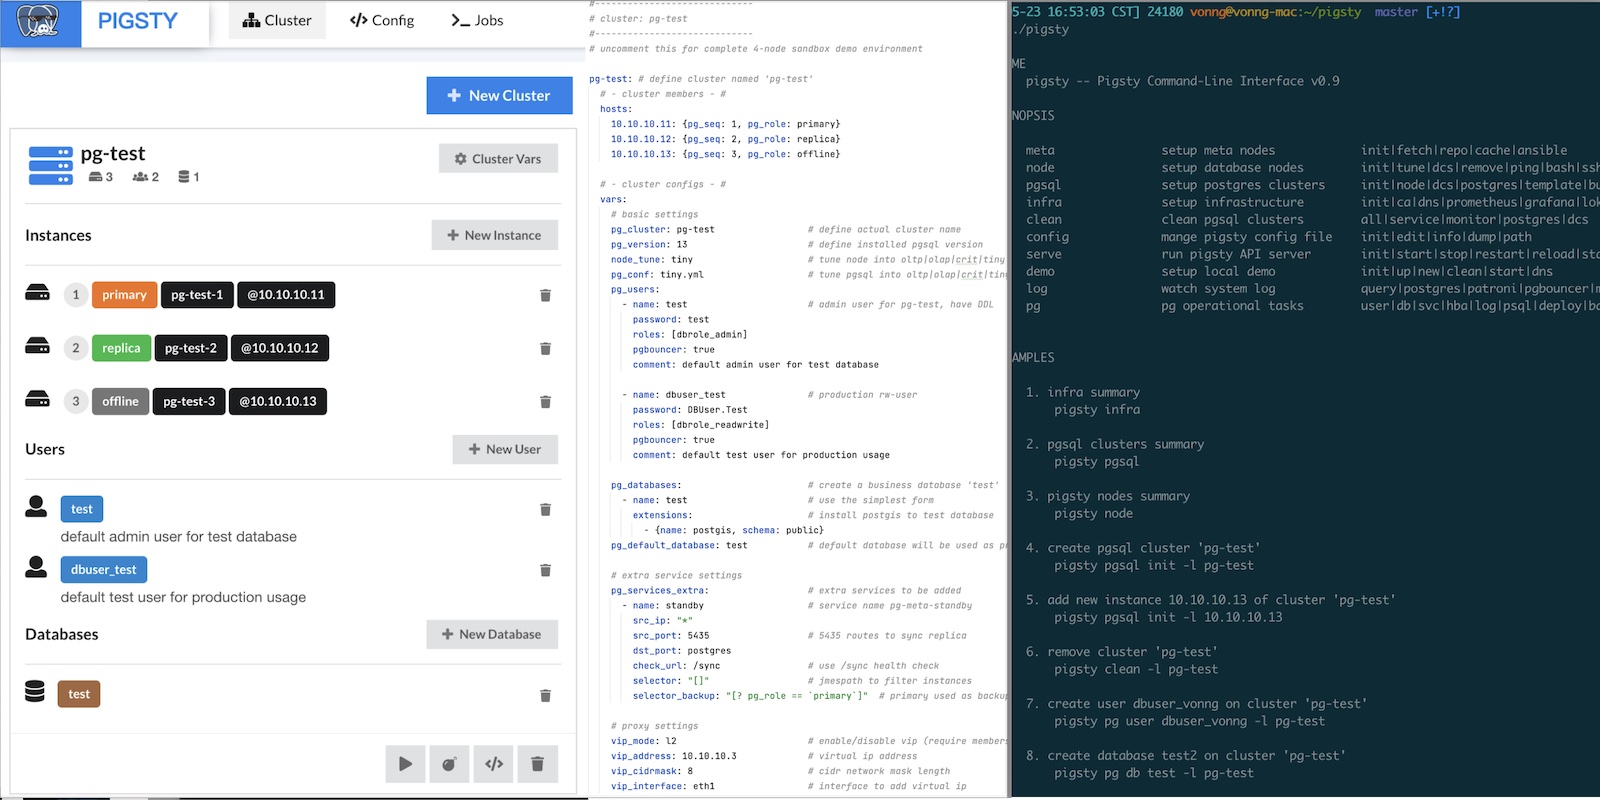
Flexible Open Extension Mechanism
PostgreSQL’s extensibility has always been praised, with various extension plugins making PostgreSQL the most advanced open-source relational database. Pigsty also respects this value, providing an extension mechanism called “Datalet” that allows users and developers to further customize Pigsty for “unexpected” use cases, such as: data analysis and visualization.

When we have monitoring systems and management solutions, we also have the ready-to-use visualization platform Grafana and the powerful database PostgreSQL. This combination has tremendous power — especially for data-intensive applications. Users can perform data analysis and data visualization without writing frontend or backend code, creating richly interactive data application prototypes, or even the applications themselves.
Pigsty integrates Echarts and common map base layers, making it easy to implement advanced visualization needs. Compared to traditional scientific computing languages/plotting libraries like Julia, Matlab, and R, the PG + Grafana + Echarts combination allows you to create shareable, deliverable, standardized data applications or visualization works at extremely low cost.
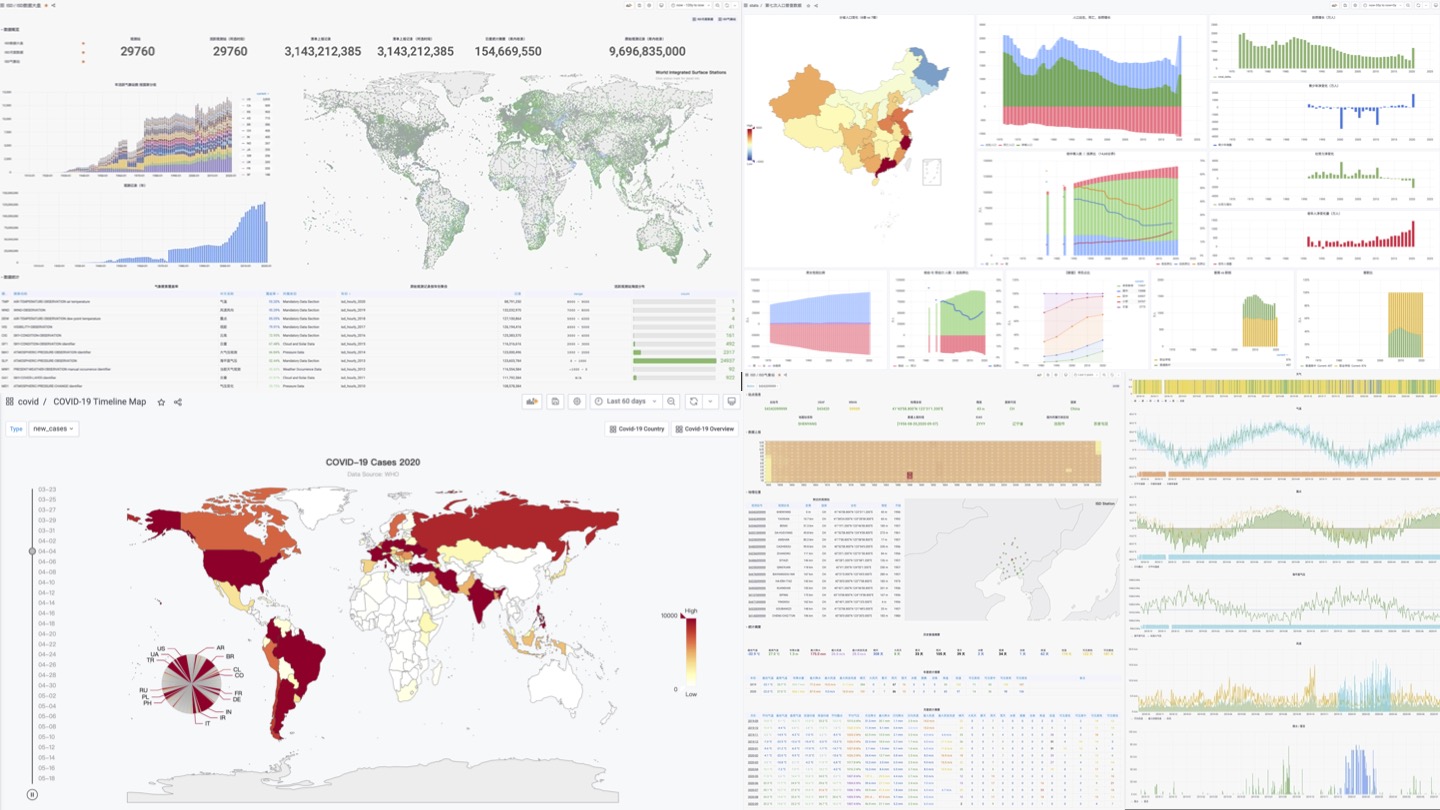
Pigsty’s monitoring system itself is an exemplar of Datalet: all Pigsty advanced topic monitoring panels are released as Datalets. Pigsty also comes with some interesting Datalet examples: Redis monitoring system, COVID-19 data analysis, 7th population census data analysis, PG log mining, etc. More ready-to-use Datalets will be added later, continuously expanding Pigsty’s functionality and application scenarios.
Free Friendly Open-Source License
Once open source gets good enough, competing with it would be insane.
Larry Ellison —— Oracle CEO
In the software industry, open source is a major trend. The history of the internet is the history of open-source software. One core reason the IT industry has today’s prosperity and people can enjoy so many free information services is open-source software. Open source is a truly successful form of communism by developers (translating as community-ism would be more appropriate): software, the core means of production in the IT industry, becomes publicly owned by developers worldwide — everyone for me, me for everyone.
When an open-source programmer works, their labor might actually contain the crystallized wisdom of tens of thousands of top developers. Through open source, all community developers form a united force, greatly reducing the internal friction of reinventing wheels and allowing the entire industry’s technical level to advance at an unimaginable speed. Open source’s momentum is like a snowball that has become unstoppable today. Except for some special scenarios and path dependencies, doing closed-door development for self-reliance in software development has become a big joke.
Relying on open source, giving back to open source. Pigsty adopts the friendly Apache License 2.0, which can be used commercially for free. As long as you comply with Apache 2 License’s attribution clauses, cloud vendors and software vendors are welcome to integrate and develop secondary commercial products.
About Pigsty
A system cannot be successful if it is too strongly influenced by a single person. Once the initial design is complete and fairly robust, the real test begins as people with many different viewpoints undertake their own experiments. — Donald Knuth
Pigsty is built around the open-source database PostgreSQL. PostgreSQL is the world’s most advanced open-source relational database, and Pigsty’s goal is to be the best open-source PostgreSQL distribution.
Initially, Pigsty didn’t have such grand goals. Because I couldn’t find any monitoring system on the market that met my needs, I had to roll up my sleeves and make one myself. Unexpectedly, it worked exceptionally well, and quite a few external organizations and PG users hoped to use it. Subsequently, deployment and delivery of the monitoring system became a problem, so the database deployment management part was added; after production environment application, developers wanted local sandbox environments for testing, so local sandboxes were added; users complained that ansible wasn’t user-friendly, so the pigsty-cli command-line tool wrapper was created; users wanted to edit configuration files through UI, so Pigsty GUI was born. Like this, needs grew and features became richer, Pigsty became more complete through long-term polishing, far exceeding initial expectations.
Doing this is itself a challenge — making a distribution is somewhat like making a RedHat, making a SUSE, making an “RDS product.” Usually only professional companies and teams of a certain scale would attempt this. But I just wanted to try: is it possible for one person? Actually, besides being slower, there’s nothing impossible. Switching between product manager, developer, and end-user roles is a very interesting experience, and the biggest benefit of “eating dog food” is that you’re both developer and user — you know what you need and won’t slack off on your own requirements.
However, as Knuth said: “A system with too strong a personal touch cannot succeed.” To make Pigsty a project with vigorous vitality, it must be open-sourced and used by more people. “When the initial design is complete and stable enough, the real challenge begins when various users use it in their own ways.”
Pigsty has solved my own problems and needs very well. Now I hope it can help more people and make PostgreSQL’s ecosystem more prosperous and colorful.
2.8 - Pigsty v0.9: CLI + Logs
Originally published on VONNG.
GitHub Release: https://github.com/pgsty/pigsty/releases/tag/v0.9.0
New Stuff
- One-liner install:
curl -fsSL https://pigsty.cc/install | bashbootstraps everything. pigsty-cli: wraps the common Ansible playbooks so you stop copy-pasting command lines. Still beta but already handy.- Loki + Promtail: Postgres, pgbouncer, and Patroni logs stream into Grafana with metrics extracted from log volume.
infra-loki.ymlandpgsql-promtail.ymlwire things up. - Binary exporters: grab monitoring binaries with
files/get_bin.shif you don’t want to rely on repos. - Flight mode: once the meta node is initialized you can run
bin/upgradeto switch into a dynamic inventory using data stored insidepg-meta.
Fixes
- Cleaned up HAProxy health checks that were flooding PG and Patroni logs with
connection resetnoise. - Patroni logs now carry readable timestamps (no more millisecond fragments) and explicit time zones.
- Monitoring queries run by
dbuser_monitorlog only when slower than 1s. - Grafana role refactor keeps the API stable, but uses CDN-hosted plugin bundles for faster installs.
- Pgbouncer user creation now handles md5 passwords properly.
- Hardened SQL templates for DB/user creation, fixed DNS orchestration edge cases, and tidied Makefile typos.
Knob Changes
node_disable_swapdefaults tofalse; Pigsty no longer nukes swap by default.node_sysctl_paramsstops writing kernel tunables unless you explicitly set them.grafana_plugin: installnow means “download from CDN if cache is missing.”repo_url_packagespulls extra RPMs from the Pigsty CDN so installs inside China work out of the box.proxy_env.no_proxyincludes the CDN endpoints.grafana_customizedefaults tofalse; flip it on only if you have the Pigsty Pro UI bits.node_admin_pk_currentadds your current~/.ssh/id_rsa.pubto the admin account.- Loki/Promtail knobs:
loki_clean,loki_data_dir,promtail_enabled,promtail_clean,promtail_port,promtail_status_file,promtail_send_url.
2.9 - Pigsty v0.8: Service Provisioning
Originally published on VONNG.
GitHub Release: https://github.com/pgsty/pigsty/releases/tag/v0.8.0
v0.8 finalizes the provisioning API. Services are completely rebuilt: instead of a hard-coded primary/replica pair you can now declare any number of services, plug in HAProxy, swap in an external load balancer, or hand off to a custom VIP controller. Everything else in the supply chain stabilizes on top of this model.
Service API
The old vip and haproxy knobs moved under the service role. pg_services (plus pg_services_extra) define each exposed endpoint—name, ports, selectors, health checks, weights, and balancer hints. Selectors are JMESPath filters over cluster members, and optional selector_backup pools handle fail-in when replicas are gone. Out of the box we ship primary, replica, default, and offline service definitions; swap dst_port to point at postgres, pgbouncer, or any number.
The HAProxy stanza keeps per-service tuning (maxconn, algorithm, timeouts) while VIP config distinguishes L2/L4 implementations so you can drop Pigsty behind an existing load balancer.
Database Interface Tweaks
Locales can now be split into lc_collate and lc_ctype so extensions like pg_trgm behave with non-C collations. The rest of the pg_databases schema stays the same—owner/template/encoding/connlimit/revokeconn/pgbouncer/comment—just with better defaults and inline comments.
2.10 - Pigsty v0.7: Monitor-Only Deployments
Originally published on VONNG.
GitHub Release: https://github.com/pgsty/pigsty/releases/tag/v0.7.0
Pigsty v0.7 focuses on plugging existing fleets into Pigsty’s observability stack. The new monitor-only flow lets you drop Pigsty dashboards onto databases that were provisioned elsewhere, and the declarative APIs for databases and users got a much needed redesign.
Highlights
- Monitor-only deployment flow (
monly) with its own playbook. - Split static Prometheus target files by cluster for easier hand-editing.
- New helper playbooks:
pgsql-createuser.ymlandpgsql-createdb.ymlfor live clusters. - Database and user schema definitions now cover owner/template/locale knobs plus per-role capabilities.
- Bug fixes for extension schema typos and pgbouncer reload.
API Changes
New options:
Removed option:
Structures affected: pg_default_roles, pg_users, pg_databases. Also fixed the pg_default_privilegs typo → pg_default_privileges.
Monitor-Only Mode
When you just want Pigsty’s observability without touching the way databases were provisioned, run the monly flow. Infra still gets bootstrapped on the meta node via ./infra.yml, but database nodes skip the provisioning playbooks and only run ./pgsql-monitor.yml. Config gets much shorter—most of the time you only keep infra vars and a handful of monitoring knobs.
Database Provisioning Interface
pg_databases now exposes owner/template/encoding/locale/connlimit/allowconn knobs plus revokeconn (strip CONNECT from public) and inline comments. Use ./pgsql-createdb.yml -e pg_database=<name> to create or mutate live databases; the generated SQL lives inside /pg/tmp/pg-db-<name>.sql on the primary.
User Provisioning Interface
pg_users swapped username → name, groups → roles, and exploded options into discrete flags (login, superuser, createdb, createrole, inherit, replication, bypassrls, connlimit). Users can also get expire_at / expire_in timers plus pgbouncer defaults to false. Apply changes through ./pgsql-createuser.yml -e pg_user=<name> which renders /pg/tmp/pg-user-<name>.sql on the primary.
2.11 - Pigsty v0.6: Provisioning Upgrades
Originally published on VONNG.
GitHub Release: https://github.com/pgsty/pigsty/releases/tag/v0.6.0
Pigsty v0.6 responds to user feedback with a redesigned provisioning path plus a monitoring stack that can sit beside any managed PG fleet—even a MyBase cluster built elsewhere.
Bug Fixes
- Patroni no longer resets PG HBA on restart.
- Fixed copy typos and the default primary for the
pg-testsandbox cluster. - Patched the dashboard title typo on PG Overview.
Feature Work
- Monitoring supply chain overhaul: Prometheus can now run fully static, exporters accept
service_registrytoggles, andexporter_binary_installlets you drop binaries without hitting repos. Each exporter has its own*_enabledflag. - Prometheus static discovery is rendered straight from inventory, so you can graft Pigsty dashboards onto any PG-as-a-service footprint.
- HAProxy provisioning adds a global console at
h.pigsty, optional auth, fallback routing to the primary when all replicas die, and per-service weight tuning. - ACL defaults now include
dbrole_offlinefor slow-query/ETL workloads plus HBA rules that fence those workloads to marked nodes. - Component refresh: PostgreSQL 13.2, Prometheus 2.25, pg_exporter 0.3.2, node_exporter 1.1, Consul 1.9.3, and a faster ZJU PG mirror.
API Changes
New knobs:
Removed knobs:
2.12 - Pigsty v0.5: Declarative DB Templates
Originally published on VONNG.
GitHub Release: https://github.com/pgsty/pigsty/releases/tag/v0.5.0
v0.5.0
Outline
- The official docs site (http://pigsty.cc/) is live.
- Database templating becomes fully declarative: define users, roles, databases, ACLs, extensions, and schemas in config.
- The default access model is refined and HBA management now comes straight from Pigsty instead of Patroni.
- Grafana provisioning switched from shoving a sqlite file to JSON provisioning via API.
- Added the
pg-cluster-replicationdashboard to the open bundle. - CentOS 7.8 offline bundle:
pkg.tgz.
Declarative Database Layouts
Multi-tenant headaches go away once everything is described as code. The new templates let you declare users, passwords, role hierarchies, DB defaults, extensions, schemas, and default privileges in YAML so a single config file replaces piles of runbooks. A stripped example:
Templates and Permissions
Two SQL templates (pg-init-template.sql for template1 and pg-init-business.sql for business databases) now give you hooks to seed any custom logic. The default ACL layout was tightened for multi-tenant instances: regular users no longer get implicit CONNECT on foreign databases, CREATE on their own DB, or CREATE inside public.
Provisioning Updates
Grafana provisioning now happens through the API, so you can feed dashboards into an existing Grafana by simply pointing grafana_url at a username/password endpoint. Pigsty generates HBAs on its own so Patroni stays focused on HA, and the supply chain is cleaner.
2.13 - Pigsty v0.4: PG13 and Better Docs
Originally published on VONNG.
GitHub Release: https://github.com/pgsty/pigsty/releases/tag/v0.4.0
Pigsty v0.4 is our second public beta. The observability stack was rebuilt around Grafana 7.3, and ten curated dashboards became the default open-source payload. pg_exporter 0.3.1 drives metrics, and the alert wiring has been cleaned up for the new Grafana release.
Open-Source Dashboards
The OSS build now exposes ten high-signal Grafana panels: PG Overview, Cluster, Service, Instance, Database, Query, Table, Table Catalog, Table Detail, and Node. Even with a lean set it easily outclasses most “enterprise” PG monitoring suites.
Software Refresh
- PostgreSQL 13.1 + Patroni 2.0.1-4, with citus added to the repo
- pg_exporter upgraded to 0.3.1
- Grafana jumps to 7.3; a ton of compatibility fixes landed
- Prometheus 2.23 with the new UI enabled
- Consul 1.9 and related components updated
Other Improvements
- Updated Prometheus alert rules and Alertmanager info links
- Fixed a batch of bugs and typos
- Added a tiny backup script for quick dumps
Offline Bundle
Need an air-gapped install? Grab the CentOS 7.8 package bundle (pkg.tgz) from GitHub and deploy from local media.
2.14 - Pigsty v0.3: First Public Beta
Originally published on VONNG.
GitHub Release: https://github.com/pgsty/pigsty/releases/tag/v0.3.0
Pigsty v0.3.0 is the very first public preview. It packages a lean observability stack plus a reproducible offline bundle so you can spin up a real PostgreSQL lab without touching the public Internet.
Observability Stack
The open build ships eight curated Grafana dashboards: PG Overview, Cluster, Service, Instance, Database, Table Overview, Table Catalog, and a bare-metal Node view. Even with a trimmed set the coverage still crushes most “enterprise” monitoring stories.
Offline Bundle
Shipyard environments can fetch the CentOS 7.8 offline bundle directly from GitHub (pkg.tgz). Drop it on the management node and you have a deterministic install no matter how broken the mirrors are.
3 - Design
Architecture decisions and implementation notes for Pigsty engineering.
Design notes document the context, constraints, decisions, and trade-offs behind Pigsty’s architecture and implementation.