Monitoring System
Historical documentation restored from the Pigsty v1.5.1 tag.
Historical documentation restored from the Pigsty v1.5.1 tag.
How to use Pigsty to monitor existing PostgreSQL instances?
For existing Pigsty instances that Pigsty does not create, some additional configuration is required if they are monitored using Pigsty’s monitoring system.
TL; DR
-
Create the monitoring object in the target instance: monitoring object configuration.
-
Declare the cluster in the inventory.
pg-test:
  hosts:                                # Assign unique local ports to each instance
    10.10.10.11: { pg_seq: 1, pg_role: primary , pg_exporter_port: 20001}
    10.10.10.12: { pg_seq: 2, pg_role: replica , pg_exporter_port: 20002}
    10.10.10.13: { pg_seq: 3, pg_role: offline , pg_exporter_port: 20003}
  vars:
    pg_cluster: pg-test                 # Fill in the cluster name
    pg_version: 14                      # Fill in the major version of the database
    pg_databases: [{ name: test }]      # Fill in the database list (each database object as an array element)

#  Provide monitoring user passwords in global/cluster/instance configs  pg_monitor_username/pg_monitor_password
-
Execute the playbook against the cluster: ./pgsql-monly.yml -l pg-test.
-
The playbook registers the target PostgreSQL data source in Grafana so that PGCAT functionality is fully available. The playbook deploys PG Exporter on the meta node to monitor remote PG instances, so pure database-related metrics in PGSQL are available. However, host node, connection pool, load balancing, and HA Patroni metrics are unavailable.
Overview
Suppose you want to use Pigsty for monitoring only. In that case, you can use monly mode. You can use Pigsty to manage and monitor other PostgreSQL instances (currently, 10+ versions are supported by default, the pg_exporter configuration file can manually modify older versions).
First, you need to complete the standard installation process of Pigsty on one meta node, and then you can connect more database instances to monitoring. According to the access rights of the target database node, there are two different cases.
Target nodes can be managed.
If the target DB node can be managed by Pigsty (ssh reachable, sudo available), you can use the pg-exporter task of the pgsql.yml playbook to deploy the monitoring component on the target node in the same way: PG Exporter. You can also use the other tasks of the playbook to deploy additional components and their monitoring on the existing instance node: connection pool Pgbouncer and load balancer HAProxy. In addition, the node-exporter and promtail tasks in nodes.yml can also be used to deploy the host node monitoring and log collection components on existing instance nodes. And log collection components.
Since the target database cluster already exists, you will need to manually create monitoring users, modes, and extensions on the target database cluster as described in this section. The rest of the process is no different from full deployment.
# Modify the pigsty config, add the yum repo to the node, and install the package via yum
exporter_install: yum # none|yum|binary, none by default
exporter_repo_url: http://<your primary ip address>/pigsty.repo

./nodes.yml -l <yourcluster> -t node-exporter  # Deployment Node Metrics Monitoring
./nodes.yml -l <yourcluster> -t promtail       # Deployment Node Log Collection
./pgsql.yml -l <yourcluster> -t pg-exporter    # Deployment of PG metrics monitoring collection
Database connection string only.
If you can only access the target database using a PGURL (database connection string), consider monitoring the target database’s Monly mode/Basic mode. All monitoring components are deployed on the meta node where Pigsty is installed in this mode. The monitoring system will not have metrics related to nodes, connection pools, load balancers, and HA components, but the database and real-time status information in the Data Catalog will still be available.
To perform a lean monitoring deployment, you will also need to manually create monitoring users, modes, and extensions on the target database cluster as described in this section and ensure that the target database can be accessed from the meta node using monitoring users. After that, execute the pgsql-monly.yml playbook against the target cluster to complete the deployment.
This article focuses on this monly deployment mode.
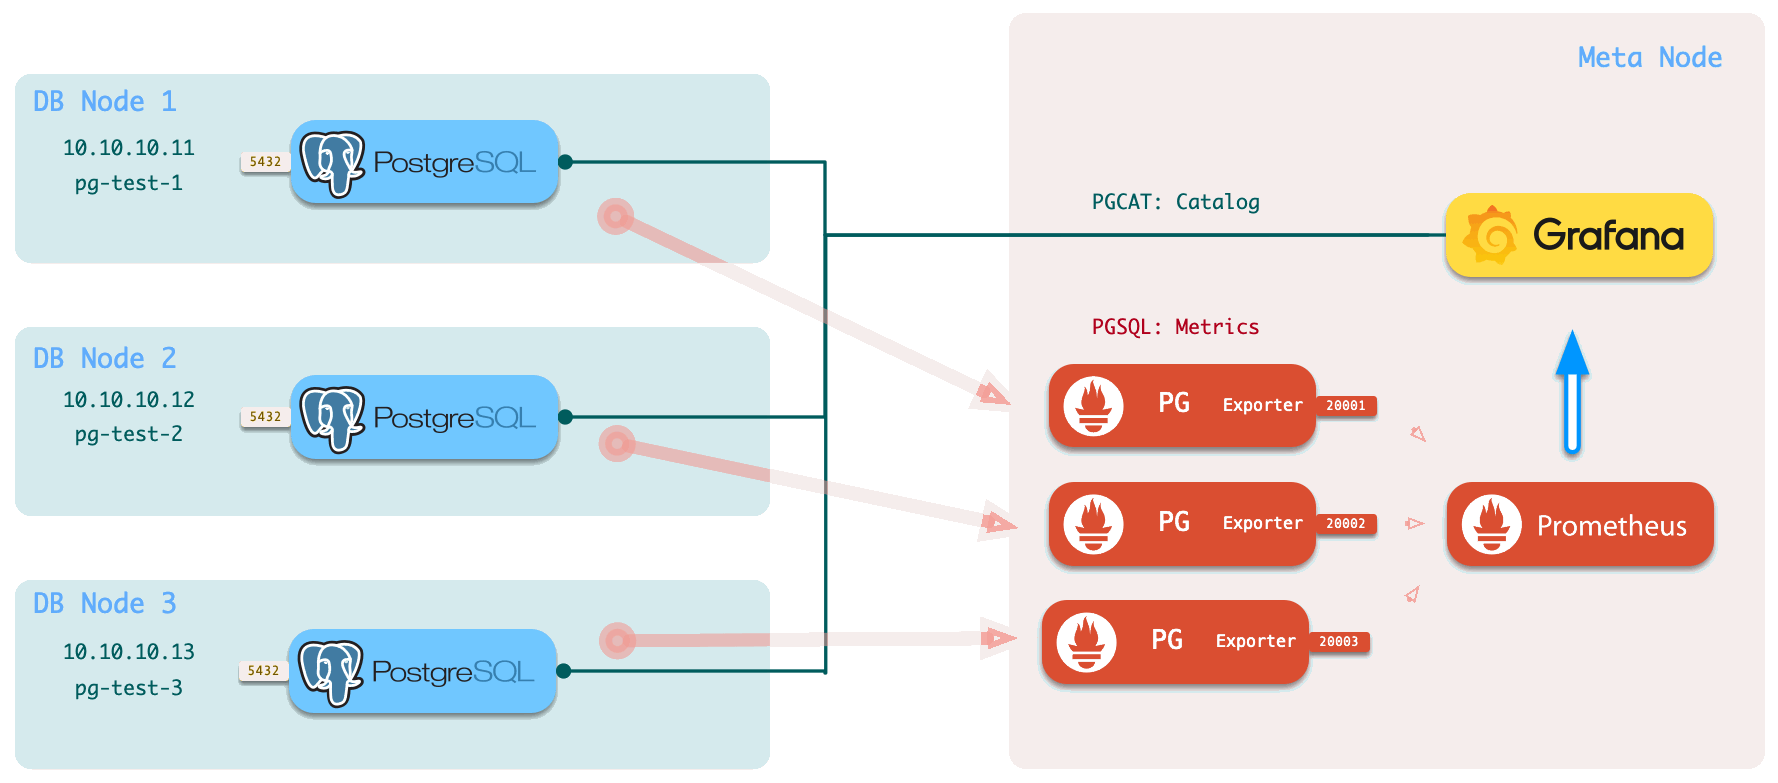
Figure: the monly mode architecture, with multiple PG Exporter, deployed locally on the management machine for monitoring multiple remote database instances.
Difference
The Pigsty monitoring system consists of three core modules:
Basic Deploy
Deploying a monitoring system for a database instance is divided into three steps: Prepare Targets, Modify Inventory, and Execute Playbook.
Prepare Targets
To include an external existing PostgreSQL instance in monitoring, a connection string that can be used to access the instance/cluster is required. It is recommended to use a dedicated monitoring user to avoid privilege leaks.
For details on the preparation of monitoring objects, please refer to Monitoring Object Config.
Modify Inventory
This target cluster must be declared in the inventory (config file or CMDB). For example, specify the identity for the cluster with the instance. It is also necessary to manually assign a unique local port ( pg_exporter_port) to each instance at the instance level.
The following is a sample database cluster declaration.
pg-test:
  hosts:                                # Assign unique local ports to each instance
    10.10.10.11: { pg_seq: 1, pg_role: primary , pg_exporter_port: 20001}
    10.10.10.12: { pg_seq: 2, pg_role: replica , pg_exporter_port: 20002}
    10.10.10.13: { pg_seq: 3, pg_role: offline , pg_exporter_port: 20003}
  vars:
    pg_cluster: pg-test                 # Fill in cluster name
    pg_version: 14                      # Fill in the major version of the database
    pg_databases: [{ name: test }]      # Fill in the database list (each database object as an array element)

#  Provide monitoring user passwords in global/cluster/instance configs  pg_monitor_username/pg_monitor_password
Even if you access the database through a domain name, you still need to declare the database cluster by filling in the actual IP.
To enable the PGCAT feature, you need to explicitly list in pg_databases the list of database names of the target cluster registered as Grafana’s data source and can access the Catalog data of that instance through Grafana. If you do not use the PGCAT function, do not set this variable or set it to an empty array.
Connect Info
Note: Pigsty will default generate the monitor connection string using the following rules. However, the pg_exporter_url will directly override the spliced connection string if it exists.
postgres://{{ pg_monitor_username }}:{{ pg_monitor_password }}@{{ inventory_hostname }}:{{ pg_port }}/postgres?sslmode=disable
You can constantly monitor user/password globally or configure the following connection parameters on-demand at the cluster or instance level.
pg_monitor_username: dbuser_monitor  # Monitor user name, no need to configure here if using the global config
pg_monitor_password: DBUser.Monitor  # Monitor user passwords, no need to configure here if using the global config
pg_port: 5432                        # If you use a non-standard database port, modify it here
Example: Specifying connect information at the instance-level
pg-test:
  hosts:                                # Specify the access URL for the instance
    10.10.10.11:
      pg_seq: 1
      pg_role: primary
      pg_exporter_port: 20001
      pg_monitor_username: monitor_user1
      pg_monitor_password: monitor_pass1
    10.10.10.12:
      pg_seq: 2
      pg_role: replica
      pg_exporter_port: 20002           # Specify pg_exporter_url directly
      pg_exporter_url: 'postgres://someuser:[email protected]:5432/postgres?sslmode=disable''
    10.10.10.13:
      pg_seq: 3
      pg_role: offline
      pg_exporter_port: 20003
      pg_monitor_username: monitor_user3
      pg_monitor_password: monitor_pass3
  vars:
    pg_cluster: pg-test                 # Fill in cluster name
    pg_version: 14                      # Fill in the major version of the database
    pg_databases: [{ name: test }]      # Fill in the database list (each database object as an array element)
Execute Playbook
Once the cluster declaration is complete, use the playbook pgsql-monly.yml on the meta node against the target cluster.
./pgsql-monly.yml -l <cluster> # Complete monitoring deployment on a specified cluster
Monitor Preparation
In monitor mode, the target DB nodes can be managed by Pigsty (ssh reachable, sudo available), and the user will install the following monitoring components on the existing nodes: promtail, node_exporter, pg_exporter.
You can use the node-exporter task in nodes.yml and the pg-exporter task in the pgsql.yml playbook to deploy the monitoring component on the target node: node_exporter with pg_exporter.
Because the target database cluster already exists, you need to create monitor users, modes & extensions on the target database cluster.
# Modify the pigsty config parameters, add the yum repo to the node, and install the package via yum
exporter_install: yum # none|yum|binary, none by default
exporter_repo_url: http://<your primary ip address>/pigsty.repo

./nodes.yml -l <yourcluster> -t promtail       # Deployment node log collection (optional)
./nodes.yml -l <yourcluster> -t node-exporter  # Deployment Node Metrics Monitoring
./pgsql.yml -l <yourcluster> -t pg-exporter    # Deployment of PG metrics collection
When the value of exporter_install is yum, Pigsty will download from the URL specified by the exporter_repo_url Repo file to the node’s local /etc/yum.repos.d. You should fill in the Pigsty local source address on the meta node, for example, http://10.10.10.10/pigsty.repo.
Targets Config
How to configure users, modes, extensions, views, and functions required for monitoring existing instances.
Monitor user
Take the monitoring user dbuser_monitor used by Pigsty by default as an example, and create the following user in the target cluster.
CREATE USER dbuser_monitor;
GRANT pg_monitor TO dbuser_monitor;
COMMENT ON ROLE dbuser_monitor IS 'system monitor user';
ALTER USER dbuser_monitor SET log_min_duration_statement = 1000;
ALTER USER dbuser_monitor PASSWORD 'DBUser.Password'; -- Change monitor user password as needed
Please note that the monitor user and password created need to be the same as pg_monitor_username and pg_monitor_password stay consistent.
Configure the database file pg_hba.conf by adding the following rules to allow monitoring users to access the database from local, and management machines using passwords.
# allow local role monitor with password
local all dbuser_monitor md5
host all dbuser_monitor 127.0.0.1/32 md5
host all dbuser_monitor <management machine IP address>/32 md5
Monitor mode
It is recommended to create a monitor mode and enable at least the pg_stat_statements that come with PG, which provides essential data on query performance. Note: This extension must be included in the database parameter shared_preload_libraries. Modifying this parameter requires a database restart.
Creating an extension mode.
CREATE SCHEMA IF NOT EXISTS monitor; -- Create a monitor-specific mode
GRANT USAGE ON SCHEMA monitor TO dbuser_monitor; -- Allow monitor users to use
Monitor extensions
Create extension plugins.
-- It is highly recommended to enable the pg_stat_statements extension
CREATE EXTENSION IF NOT EXISTS "pg_stat_statements" WITH SCHEMA "monitor";

-- optional other extensions
CREATE EXTENSION IF NOT EXISTS "pgstattuple" WITH SCHEMA "monitor";
CREATE EXTENSION IF NOT EXISTS "pg_qualstats" WITH SCHEMA "monitor";
CREATE EXTENSION IF NOT EXISTS "pg_buffercache" WITH SCHEMA "monitor";
CREATE EXTENSION IF NOT EXISTS "pageinspect" WITH SCHEMA "monitor";
CREATE EXTENSION IF NOT EXISTS "pg_prewarm" WITH SCHEMA "monitor";
CREATE EXTENSION IF NOT EXISTS "pg_visibility" WITH SCHEMA "monitor";
CREATE EXTENSION IF NOT EXISTS "pg_freespacemap" WITH SCHEMA "monitor";
Monitor Views
The monitoring view shows common preprocessing results and wraps privileges for specific monitoring metrics (e.g., shared memory allocation). It is highly recommended to create it in all databases that need to be monitored.
Monitor Views
--==================================================================--
--                            Monitor Schema                        --
--==================================================================--

----------------------------------------------------------------------
-- cleanse
----------------------------------------------------------------------
CREATE SCHEMA IF NOT EXISTS monitor;
GRANT USAGE ON SCHEMA monitor TO dbuser_monitor;
GRANT USAGE ON SCHEMA monitor TO "{{ pg_admin_username }}";
GRANT USAGE ON SCHEMA monitor TO "{{ pg_replication_username }}";

--==================================================================--
--                            Monitor Views                         --
--==================================================================--

----------------------------------------------------------------------
-- Table bloat estimate : monitor.pg_table_bloat
----------------------------------------------------------------------
DROP VIEW IF EXISTS monitor.pg_table_bloat CASCADE;
CREATE OR REPLACE VIEW monitor.pg_table_bloat AS
SELECT CURRENT_CATALOG AS datname, nspname, relname , tblid , bs * tblpages AS size,
       CASE WHEN tblpages - est_tblpages_ff > 0 THEN (tblpages - est_tblpages_ff)/tblpages::FLOAT ELSE 0 END AS ratio
FROM (
         SELECT ceil( reltuples / ( (bs-page_hdr)*fillfactor/(tpl_size*100) ) ) + ceil( toasttuples / 4 ) AS est_tblpages_ff,
                tblpages, fillfactor, bs, tblid, nspname, relname, is_na
         FROM (
                  SELECT
                      ( 4 + tpl_hdr_size + tpl_data_size + (2 * ma)
                          - CASE WHEN tpl_hdr_size % ma = 0 THEN ma ELSE tpl_hdr_size % ma END
                          - CASE WHEN ceil(tpl_data_size)::INT % ma = 0 THEN ma ELSE ceil(tpl_data_size)::INT % ma END
                          ) AS tpl_size, (heappages + toastpages) AS tblpages, heappages,
                      toastpages, reltuples, toasttuples, bs, page_hdr, tblid, nspname, relname, fillfactor, is_na
                  FROM (
                           SELECT
                               tbl.oid AS tblid, ns.nspname , tbl.relname, tbl.reltuples,
                               tbl.relpages AS heappages, coalesce(toast.relpages, 0) AS toastpages,
                               coalesce(toast.reltuples, 0) AS toasttuples,
                               coalesce(substring(array_to_string(tbl.reloptions, ' ') FROM 'fillfactor=([0-9]+)')::smallint, 100) AS fillfactor,
                               current_setting('block_size')::numeric AS bs,
                               CASE WHEN version()~'mingw32' OR version()~'64-bit|x86_64|ppc64|ia64|amd64' THEN 8 ELSE 4 END AS ma,
                               24 AS page_hdr,
                               23 + CASE WHEN MAX(coalesce(s.null_frac,0)) > 0 THEN ( 7 + count(s.attname) ) / 8 ELSE 0::int END
                                   + CASE WHEN bool_or(att.attname = 'oid' and att.attnum < 0) THEN 4 ELSE 0 END AS tpl_hdr_size,
                               sum( (1-coalesce(s.null_frac, 0)) * coalesce(s.avg_width, 0) ) AS tpl_data_size,
                               bool_or(att.atttypid = 'pg_catalog.name'::regtype)
                                   OR sum(CASE WHEN att.attnum > 0 THEN 1 ELSE 0 END) <> count(s.attname) AS is_na
                           FROM pg_attribute AS att
                                    JOIN pg_class AS tbl ON att.attrelid = tbl.oid
                                    JOIN pg_namespace AS ns ON ns.oid = tbl.relnamespace
                                    LEFT JOIN pg_stats AS s ON s.schemaname=ns.nspname AND s.tablename = tbl.relname AND s.inherited=false AND s.attname=att.attname
                                    LEFT JOIN pg_class AS toast ON tbl.reltoastrelid = toast.oid
                           WHERE NOT att.attisdropped AND tbl.relkind = 'r' AND nspname NOT IN ('pg_catalog','information_schema')
                           GROUP BY 1,2,3,4,5,6,7,8,9,10
                       ) AS s
              ) AS s2
     ) AS s3
WHERE NOT is_na;
COMMENT ON VIEW monitor.pg_table_bloat IS 'postgres table bloat estimate';

----------------------------------------------------------------------
-- Index bloat estimate : monitor.pg_index_bloat
----------------------------------------------------------------------
DROP VIEW IF EXISTS monitor.pg_index_bloat CASCADE;
CREATE OR REPLACE VIEW monitor.pg_index_bloat AS
SELECT CURRENT_CATALOG AS datname, nspname, idxname AS relname, tblid, idxid, relpages::BIGINT * bs AS size,
       COALESCE((relpages - ( reltuples * (6 + ma - (CASE WHEN index_tuple_hdr % ma = 0 THEN ma ELSE index_tuple_hdr % ma END)
                                               + nulldatawidth + ma - (CASE WHEN nulldatawidth % ma = 0 THEN ma ELSE nulldatawidth % ma END))
                                  / (bs - pagehdr)::FLOAT  + 1 )), 0) / relpages::FLOAT AS ratio
FROM (
         SELECT nspname,idxname,indrelid AS tblid,indexrelid AS idxid,
                reltuples,relpages,
                current_setting('block_size')::INTEGER                                                               AS bs,
                (CASE WHEN version() ~ 'mingw32' OR version() ~ '64-bit|x86_64|ppc64|ia64|amd64' THEN 8 ELSE 4 END)  AS ma,
                24                                                                                                   AS pagehdr,
                (CASE WHEN max(COALESCE(pg_stats.null_frac, 0)) = 0 THEN 2 ELSE 6 END)                               AS index_tuple_hdr,
                sum((1.0 - COALESCE(pg_stats.null_frac, 0.0)) *
                    COALESCE(pg_stats.avg_width, 1024))::INTEGER                                                     AS nulldatawidth
         FROM pg_attribute
                  JOIN (
             SELECT pg_namespace.nspname,
                    ic.relname                                                   AS idxname,
                    ic.reltuples,
                    ic.relpages,
                    pg_index.indrelid,
                    pg_index.indexrelid,
                    tc.relname                                                   AS tablename,
                    regexp_split_to_table(pg_index.indkey::TEXT, ' ') :: INTEGER AS attnum,
                    pg_index.indexrelid                                          AS index_oid
             FROM pg_index
                      JOIN pg_class ic ON pg_index.indexrelid = ic.oid
                      JOIN pg_class tc ON pg_index.indrelid = tc.oid
                      JOIN pg_namespace ON pg_namespace.oid = ic.relnamespace
                      JOIN pg_am ON ic.relam = pg_am.oid
             WHERE pg_am.amname = 'btree' AND ic.relpages > 0 AND nspname NOT IN ('pg_catalog', 'information_schema')
         ) ind_atts ON pg_attribute.attrelid = ind_atts.indexrelid AND pg_attribute.attnum = ind_atts.attnum
                  JOIN pg_stats ON pg_stats.schemaname = ind_atts.nspname
             AND ((pg_stats.tablename = ind_atts.tablename AND pg_stats.attname = pg_get_indexdef(pg_attribute.attrelid, pg_attribute.attnum, TRUE))
                 OR (pg_stats.tablename = ind_atts.idxname AND pg_stats.attname = pg_attribute.attname))
         WHERE pg_attribute.attnum > 0
         GROUP BY 1, 2, 3, 4, 5, 6
     ) est;
COMMENT ON VIEW monitor.pg_index_bloat IS 'postgres index bloat estimate (btree-only)';


----------------------------------------------------------------------
-- Relation Bloat : monitor.pg_bloat
----------------------------------------------------------------------
DROP VIEW IF EXISTS monitor.pg_bloat CASCADE;
CREATE OR REPLACE VIEW monitor.pg_bloat AS
SELECT coalesce(ib.datname, tb.datname)                                                   AS datname,
       coalesce(ib.nspname, tb.nspname)                                                   AS nspname,
       coalesce(ib.tblid, tb.tblid)                                                       AS tblid,
       coalesce(tb.nspname || '.' || tb.relname, ib.nspname || '.' || ib.tblid::RegClass) AS tblname,
       tb.size                                                                            AS tbl_size,
       CASE WHEN tb.ratio < 0 THEN 0 ELSE round(tb.ratio::NUMERIC, 6) END                 AS tbl_ratio,
       (tb.size * (CASE WHEN tb.ratio < 0 THEN 0 ELSE tb.ratio::NUMERIC END)) ::BIGINT    AS tbl_wasted,
       ib.idxid,
       ib.nspname || '.' || ib.relname                                                    AS idxname,
       ib.size                                                                            AS idx_size,
       CASE WHEN ib.ratio < 0 THEN 0 ELSE round(ib.ratio::NUMERIC, 5) END                 AS idx_ratio,
       (ib.size * (CASE WHEN ib.ratio < 0 THEN 0 ELSE ib.ratio::NUMERIC END)) ::BIGINT    AS idx_wasted
FROM monitor.pg_index_bloat ib
         FULL OUTER JOIN monitor.pg_table_bloat tb ON ib.tblid = tb.tblid;

COMMENT ON VIEW monitor.pg_bloat IS 'postgres relation bloat detail';


----------------------------------------------------------------------
-- monitor.pg_index_bloat_human
----------------------------------------------------------------------
DROP VIEW IF EXISTS monitor.pg_index_bloat_human CASCADE;
CREATE OR REPLACE VIEW monitor.pg_index_bloat_human AS
SELECT idxname                            AS name,
       tblname,
       idx_wasted                         AS wasted,
       pg_size_pretty(idx_size)           AS idx_size,
       round(100 * idx_ratio::NUMERIC, 2) AS idx_ratio,
       pg_size_pretty(idx_wasted)         AS idx_wasted,
       pg_size_pretty(tbl_size)           AS tbl_size,
       round(100 * tbl_ratio::NUMERIC, 2) AS tbl_ratio,
       pg_size_pretty(tbl_wasted)         AS tbl_wasted
FROM monitor.pg_bloat
WHERE idxname IS NOT NULL;
COMMENT ON VIEW monitor.pg_index_bloat_human IS 'postgres index bloat info in human-readable format';

----------------------------------------------------------------------
-- monitor.pg_table_bloat_human
----------------------------------------------------------------------
DROP VIEW IF EXISTS monitor.pg_table_bloat_human CASCADE;
CREATE OR REPLACE VIEW monitor.pg_table_bloat_human AS
SELECT tblname                                          AS name,
       idx_wasted + tbl_wasted                          AS wasted,
       pg_size_pretty(idx_wasted + tbl_wasted)          AS all_wasted,
       pg_size_pretty(tbl_wasted)                       AS tbl_wasted,
       pg_size_pretty(tbl_size)                         AS tbl_size,
       tbl_ratio,
       pg_size_pretty(idx_wasted)                       AS idx_wasted,
       pg_size_pretty(idx_size)                         AS idx_size,
       round(idx_wasted::NUMERIC * 100.0 / idx_size, 2) AS idx_ratio
FROM (SELECT datname,
             nspname,
             tblname,
             coalesce(max(tbl_wasted), 0)                         AS tbl_wasted,
             coalesce(max(tbl_size), 1)                           AS tbl_size,
             round(100 * coalesce(max(tbl_ratio), 0)::NUMERIC, 2) AS tbl_ratio,
             coalesce(sum(idx_wasted), 0)                         AS idx_wasted,
             coalesce(sum(idx_size), 1)                           AS idx_size
      FROM monitor.pg_bloat
      WHERE tblname IS NOT NULL
      GROUP BY 1, 2, 3
     ) d;
COMMENT ON VIEW monitor.pg_table_bloat_human IS 'postgres table bloat info in human-readable format';


----------------------------------------------------------------------
-- Activity Overview: monitor.pg_session
----------------------------------------------------------------------
DROP VIEW IF EXISTS monitor.pg_session CASCADE;
CREATE OR REPLACE VIEW monitor.pg_session AS
SELECT coalesce(datname, 'all') AS datname, numbackends, active, idle, ixact, max_duration, max_tx_duration, max_conn_duration
FROM (
         SELECT datname,
                count(*)                                         AS numbackends,
                count(*) FILTER ( WHERE state = 'active' )       AS active,
                count(*) FILTER ( WHERE state = 'idle' )         AS idle,
                count(*) FILTER ( WHERE state = 'idle in transaction'
                    OR state = 'idle in transaction (aborted)' ) AS ixact,
                max(extract(epoch from now() - state_change))
                FILTER ( WHERE state = 'active' )                AS max_duration,
                max(extract(epoch from now() - xact_start))      AS max_tx_duration,
                max(extract(epoch from now() - backend_start))   AS max_conn_duration
         FROM pg_stat_activity
         WHERE backend_type = 'client backend'
           AND pid <> pg_backend_pid()
         GROUP BY ROLLUP (1)
         ORDER BY 1 NULLS FIRST
     ) t;
COMMENT ON VIEW monitor.pg_session IS 'postgres activity group by session';


----------------------------------------------------------------------
-- Sequential Scan: monitor.pg_seq_scan
----------------------------------------------------------------------
DROP VIEW IF EXISTS monitor.pg_seq_scan CASCADE;
CREATE OR REPLACE VIEW monitor.pg_seq_scan AS
    SELECT schemaname                                                        AS nspname,
           relname,
           seq_scan,
           seq_tup_read,
           seq_tup_read / seq_scan                                           AS seq_tup_avg,
           idx_scan,
           n_live_tup + n_dead_tup                                           AS tuples,
           round(n_live_tup * 100.0::NUMERIC / (n_live_tup + n_dead_tup), 2) AS live_ratio
    FROM pg_stat_user_tables
    WHERE seq_scan > 0
      and (n_live_tup + n_dead_tup) > 0
    ORDER BY seq_scan DESC;
COMMENT ON VIEW monitor.pg_seq_scan IS 'table that have seq scan';
Functions to view shared memory allocations (available for PG13 and above)
DROP FUNCTION IF EXISTS monitor.pg_shmem() CASCADE;
CREATE OR REPLACE FUNCTION monitor.pg_shmem() RETURNS SETOF
    pg_shmem_allocations AS $$ SELECT * FROM pg_shmem_allocations;$$ LANGUAGE SQL SECURITY DEFINER;
COMMENT ON FUNCTION monitor.pg_shmem() IS 'security wrapper for pg_shmem';